

Component Architecture: Modeling Physical Software Parts, Libraries, and Their Dependencies for Cloud-Based Systems
By the time you reach infrastructure modeling, the system has been defined in terms of classes, packages, interactions, states, and use-case flows. Now it is time to zoom out to the physical software anatomy—the actual deployable units that will be built, versioned, packaged, and executed in production. This is the domain of Component Diagrams in UML 2.5.
A Component Diagram shows:
- Components — modular, replaceable, reusable units of implementation (microservices, JARs, DLLs, Docker images, serverless functions, shared libraries, APIs, databases drivers)
- Provided and required interfaces — contracts that define what a component offers and what it depends on
- Ports — points of interaction (typed or untyped) through which interfaces are exposed or consumed
- Connectors — assembly relationships linking provided interfaces to required ones
- Subsystems — larger-grained groupings of components
- Dependencies — usage relationships between components (e.g., “Order Service requires Payment Gateway API”)
In modern cloud-based, microservices-oriented, or containerized systems, Component Diagrams have become especially valuable for visualizing service boundaries, API contracts, shared libraries, external dependencies (third-party SaaS, cloud services), and deployment granularity—before committing to code or infrastructure-as-code definitions.
Visual Paradigm’s AI makes creating and refining these diagrams fast and conversational, generating cloud-aware, standards-compliant Component Diagrams directly from natural-language descriptions of the architecture or from existing Class/Package models.
How to Model Component Architecture with AI
-
Describe the Modular Structure in Plain English In the AI Chatbot (or via the dedicated Component Diagram Generator in the Innovation Hub), provide a high-level or detailed description:
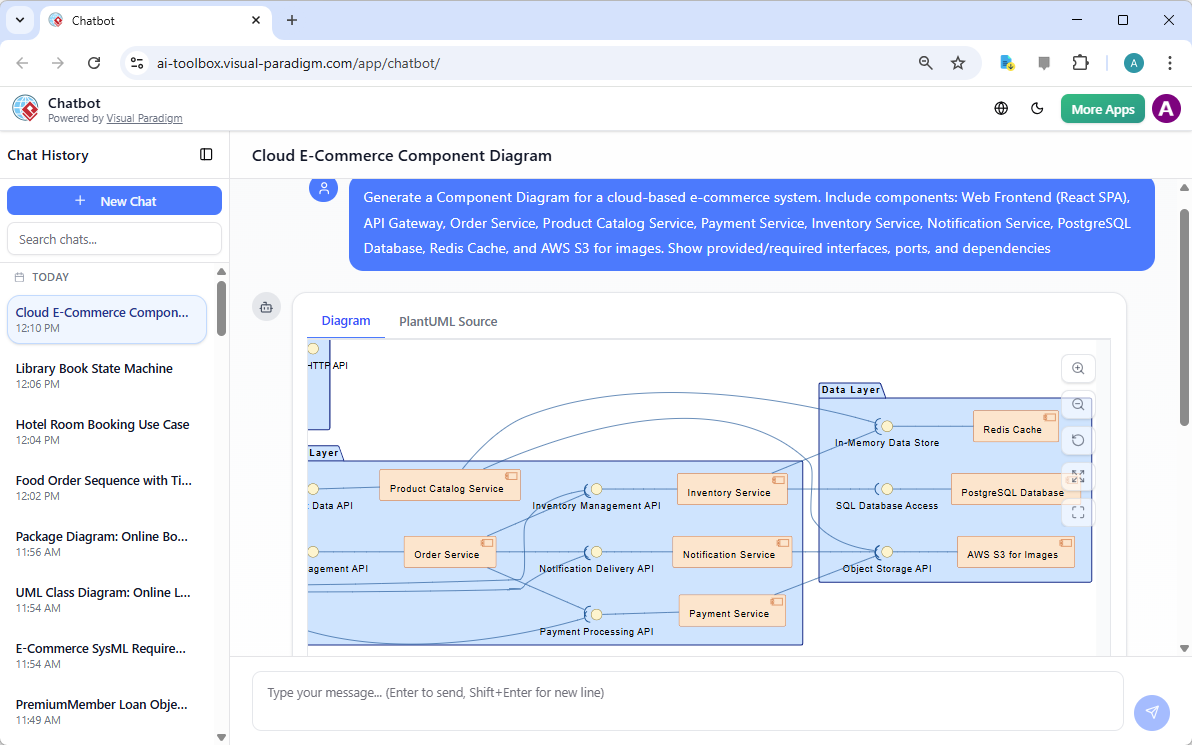
- “Generate a Component Diagram for a cloud-based e-commerce system. Include components: Web Frontend (React SPA), API Gateway, Order Service, Product Catalog Service, Payment Service, Inventory Service, Notification Service, PostgreSQL Database, Redis Cache, and AWS S3 for images. Show provided/required interfaces, ports, and dependencies.”
- “Model the microservices architecture of a ride-sharing app: Mobile App (client), API Gateway, Ride Service, User Service, Payment Service, Map Service, Notification Service. Use ports and interfaces to show REST/gRPC contracts and dependencies on external services like Google Maps API and Stripe.”
- “Create a Component Diagram showing a modular monolith with layers: Presentation (UI components), Application (controllers/services), Domain (entities/value objects), Infrastructure (repositories, external clients). Include shared libraries like Logging and Security Utils.”
-
AI Produces a Clean, Cloud-Aware Component Diagram The generated diagram includes:
- Component icons (rectangle with <<component>> stereotype or cloud-native icons when appropriate)
- Provided interfaces (lollipop notation) and required interfaces (socket notation)
- Ports (small squares on component boundary) with interface types
- Assembly connectors (ball-and-socket lines) for direct interface matching
- Delegation connectors when a subsystem delegates to internal components
- Dependency arrows (dashed with open arrowhead) for usage relationships
- Cloud-specific stereotypes (<<microservice>>, <<serverless>>, <<container>>, <<database>>, <<queue>>)
- Logical grouping and clean layout (often layered or radial to show dependencies clearly)
-
Iterative Refinement via Natural Language Evolve the architecture conversationally:
- “Add a shared Authentication Library component that provides AuthService interface required by Order Service, Payment Service, and User Service.”
- “Introduce a Message Broker (Kafka) component with publish/subscribe ports; show Order Service publishing to ‘order-events’ topic and Notification Service subscribing.”
- “Change Payment Service to use a serverless Stripe Adapter component instead of direct Stripe dependency.”
- “Add a Circuit Breaker proxy component between API Gateway and downstream services.”
- “Group Order Service, Inventory Service, and Payment Service into an ‘Order Processing Subsystem’ with exposed Order API port.”
- “Switch to hexagonal style: show domain core component surrounded by adapters for UI, Database, and External Services.”
- “Make the layout horizontal with infrastructure components at the bottom and highlight external dependencies in red.”
Diagram Touch-Up technology automatically reroutes connectors, repositions components, adjusts spacing, and maintains visual clarity—no manual cleanup needed.
Why Component Diagrams Matter for Cloud-Based Systems
| Traditional Challenges | AI-Generated Component Diagram Benefits |
|---|---|
| Microservices boundaries unclear until coding | Early visualization of service contracts and dependencies |
| Overlooked shared libraries or cross-cutting concerns | Explicit modeling of utilities, auth, logging, monitoring |
| Dependency hell discovered late | Clear required/provided interfaces and usage arrows |
| Hard to communicate architecture to DevOps/ops teams | Self-documenting view of deployable units and external integrations |
| Inconsistent naming of APIs/interfaces | Consistent UML notation + cloud stereotypes |
| Difficult to iterate on modularization | Safe, rapid “what-if” changes (add/remove services, change ports) |
Practical Tips for Cloud-Native Modeling
- Use stereotypes liberally: <<microservice>>, <<lambda>>, <<container>>, <<queue>>, <<event-bus>>, <<api-gateway>>
- Name interfaces meaningfully: OrderAPI, PaymentProviderPort, NotificationSender
- Show external cloud services as components with <<external>> or <<SaaS>> stereotypes (Stripe, Twilio, AWS S3)
- Combine with Deployment Diagrams (next section): components become artifacts deployed on nodes
- Ask for alternatives: “Show both monolithic and microservices variants side by side”
Real-World Impact
- Architecture Decision Records (ADRs) — Use the diagram to document “why we split Payment as a separate service”
- DevOps Handover — Ops/Platform teams see exactly which services need endpoints, queues, or database access
- Security & Compliance Reviews — Quickly spot dependencies on external or sensitive components
- Refactoring Guidance — Identify tightly coupled areas before they become technical debt
Component Diagrams give the system its modular, physical shape—defining the deployable building blocks that will live in containers, functions, or VMs. With AI handling notation, cloud icons, port/connector logic, and layout intelligence, you can explore architectural alternatives rapidly and confidently.
This sets the stage for the next section: mapping those components onto actual infrastructure nodes in Deployment Diagrams, bringing the design one step closer to deployable reality.