


Mastering Data Flow Diagrams: A Practical Guide
Welcome to today’s tutorial on systems analysis. Today, we are diving deep into one of the most fundamental tools for visualizing information systems: the Data Flow Diagram, or DFD. Whether you are a student learning the ropes or a professional refining your documentation skills, understanding how to map out data movement is crucial. Specifically, we will be focusing on the Yourdon DeMarco notation, a classic and highly readable style used to model system processes.
The Foundation: Yourdon DeMarco Notation
Before we analyze a complex system, we must understand the language we are speaking. The Yourdon DeMarco notation relies on four distinct symbols, each with a specific meaning. When you look at a DFD, you are essentially looking for where data comes from, where it goes, how it changes, and where it is kept.
- Processes (Circles): These represent actions or transformations. In a DFD, a process takes input data, does something with it, and produces output data. You will often see them numbered (e.g., Process 1, Process 2) to maintain a logical hierarchy.
- External Entities (Rectangles): These are the sources or destinations of data outside the system boundary. They could be people, organizations, or other systems. They initiate the data flow or receive the final result.
- Data Stores (Open-ended Rectangles): These represent places where data is stored for later use. In our notation, they look like a rectangle with two parallel lines on one side. They do not perform actions; they simply hold information.
- Data Flows (Arrows): The lines connecting everything else. They represent the movement of data. Crucially, every arrow must have a label describing exactly what data is moving.
Deconstructing the Video Rental Shop System
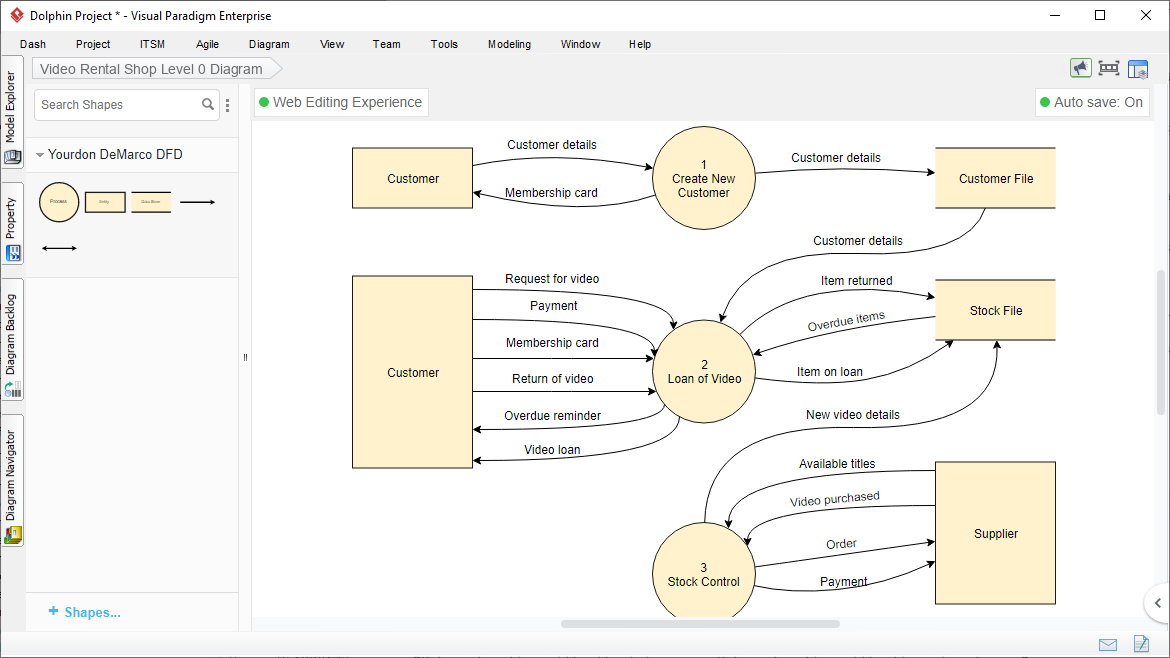
Let’s apply these concepts to the diagram above, which represents a Video Rental Shop Level 0 Diagram. This is a high-level view of how a video rental business operates. Notice how the diagram is split into logical sections, even though they are all on one canvas.
External Entities and Data Stores
First, identify the Customer and Supplier entities. These are the actors. The Customer interacts with the system to rent videos or sign up, while the Supplier provides the inventory. You will also see two Data Stores: the Customer File and the Stock File. These are the digital repositories where the shop keeps records of who is a member and what videos are in the inventory.
The Core Processes
Now, let’s look at the circles, which represent the work being done.
- Process 1: Create New Customer. This process handles the onboarding. When a new person arrives, they provide “Customer details.” The system validates this and creates a “Membership card” for them. Simultaneously, it saves their details to the Customer File for future reference.
- Process 2: Loan of Video. This is the heart of the business. It handles the transaction. The customer sends a “Request for video” and “Payment.” The system checks the Stock File to see if the item is available (“Item on loan” data flows back to the process to confirm availability). Once the loan is processed, the system updates the stock record (sending “Item returned” or “Overdue items” data) and issues the “Video loan” to the customer.
- Process 3: Stock Control. This process manages the inventory. It checks the Stock File to see “Available titles.” If stock is low, it sends an “Order” to the Supplier. When the supplier sends back “Video purchased” details, the system updates the “New video details” in the Stock File to reflect the new inventory.
Tips for Effective Diagramming
As you begin creating your own diagrams, keep these guidelines in mind to ensure clarity and professionalism.
- Label Everything: Never leave a data flow unlabeled. An arrow without text is useless. Is it “Data”? Is it “Customer Details”? Be specific.
- Balance Your Flows: Ensure that what goes into a process matches what comes out. If you have inputs, you must have outputs. If data enters a Data Store, it must eventually leave it or be updated.
- Use Consistent Naming: If you call it “Customer Details” in one place, don’t call it “Client Info” in another. Consistency prevents confusion.
Streamlining Your Workflow with Visual Tools
Creating these diagrams by hand can be messy and time-consuming. This is where modern tools like Visual Paradigm shine. As seen in the interface above, these tools offer a rich set of editing features designed to make diagramming simple and fast.
Instead of drawing lines and boxes manually, you can utilize drag-and-drop functionality. Simply pull a Process circle or an Entity rectangle from the palette and drop it onto your canvas. Furthermore, features like alignment guides ensure your diagram looks professional and organized, keeping your processes centered and your data flows straight. With support for various notations like Yourdon DeMarco, you can switch styles instantly to match your project requirements, allowing you to focus on the logic of the system rather than the aesthetics of the drawing.