


Managing growing teams requires a clear, structured way to visualize reporting lines, departmental hierarchies, and cross-functional roles. An Organizational Chart (Org Chart) serves as the visual framework for company reporting, helping leadership, HR, and project managers map out operational structures clearly. However, using drag-and-drop design tools to continuously edit team hierarchies becomes tedious as companies scale and reorganize. By switching to a modern diagram-as-code platform, HR teams and operations managers can define team hierarchies in plain text and render clean org chart diagrams automatically. Using an interactive browser-based Graphviz editor allows organizations to update hierarchy models instantly alongside company documentation.
In this guide, we will cover how to design Organizational Charts using Graphviz DOT language, build structured node cards for employee roles, and leverage a unified diagram-as-code platform for effortless organizational planning.
Why Design Organizational Charts with Graphviz DOT?
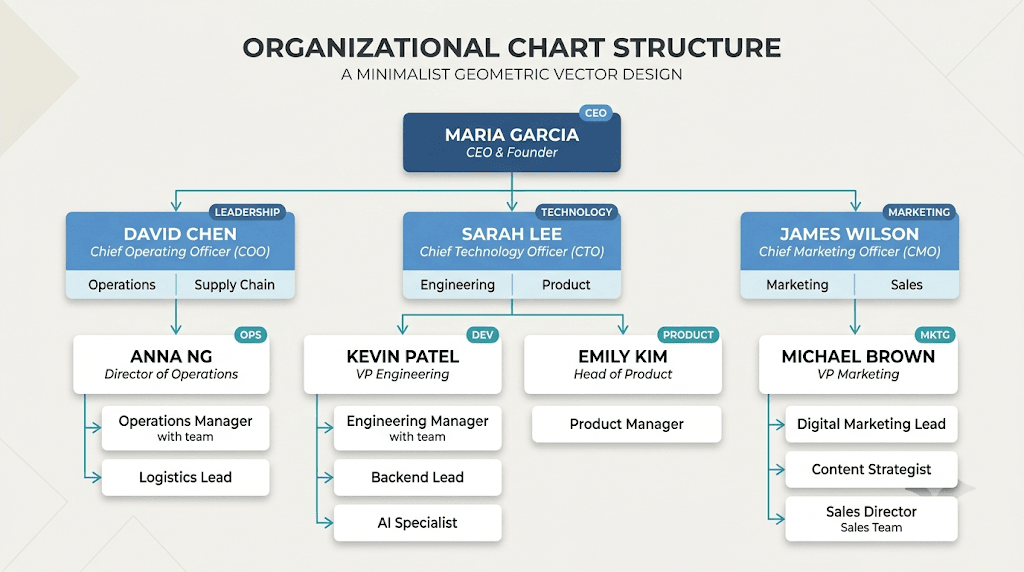
Drawing company hierarchies manually in static drawing programs often leads to misaligned cards, overlapping connector lines, and outdated charts. Text-driven diagramming automates layout formatting so you can focus entirely on organizational structures and reporting logic.
Using a browser-based Graphviz editor for org chart design offers distinct operational benefits:
- HTML-Like Record Cards: Graphviz supports HTML-like table formatting, enabling you to display titles, names, departments, and employee IDs cleanly in structured cards.
- Automated Hierarchy Alignment: The rendering engine automatically organizes nodes into distinct management levels, preventing messy cross-departmental line routing.
- Version-Controlled Org Structures: Store text-based DOT scripts in internal repositories or documentation platforms to track historical team restructures effortlessly.
Adopting an advanced diagram-as-code platform ensures your company hierarchy documentation remains accurate through every growth phase.
Building an Organizational Chart Step-by-Step
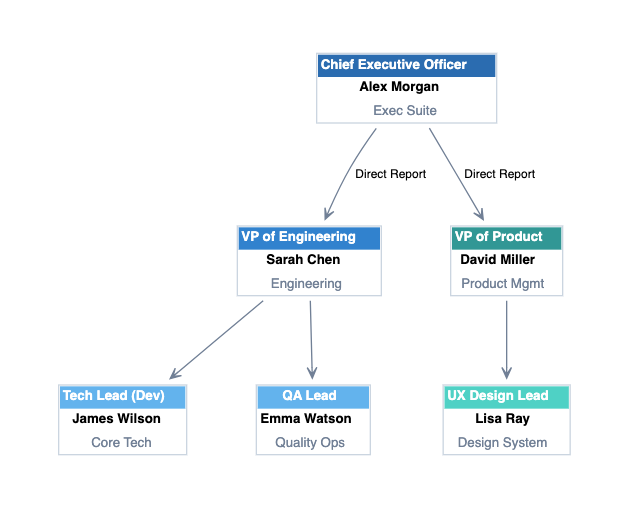
Let’s examine how to model a corporate hierarchy—featuring Executive Leadership, Engineering Management, Product Leads, and Operations—using Graphviz record shapes and HTML-like table cards. Below is a practical code example you can copy and test directly inside your browser-based Graphviz editor:
Organizational Chart Code Example (Try it Now):
digraph OrgChart {
    graph [rankdir=TB, pad="0.5", nodesep="0.5", ranksep="0.8"];
    node [shape=plaintext, fontname="Helvetica", fontsize=10];
    edge [color="#718096", fontname="Helvetica", fontsize=9, arrowhead=open, arrowsize=0.8];

    // CEO Node Card
    CEO [label=<<TABLE BORDER="1" CELLBORDER="0" CELLSPACING="0" BGCOLOR="#ffffff" COLOR="#cbd5e0">
        <TR><TD BGCOLOR="#2b6cb0" COLSPAN="2"><FONT COLOR="#ffffff"><B>Chief Executive Officer</B></FONT></TD></TR>
        <TR><TD ALIGN="CENTER" COLSPAN="2"><B>Alex Morgan</B></TD></TR>
        <TR><TD ALIGN="CENTER" COLSPAN="2"><FONT COLOR="#718096">Exec Suite</FONT></TD></TR>
    </TABLE>>];

    // VP Nodes
    VPEng [label=<<TABLE BORDER="1" CELLBORDER="0" CELLSPACING="0" BGCOLOR="#ffffff" COLOR="#cbd5e0">
        <TR><TD BGCOLOR="#3182ce" COLSPAN="2"><FONT COLOR="#ffffff"><B>VP of Engineering</B></FONT></TD></TR>
        <TR><TD ALIGN="CENTER" COLSPAN="2"><B>Sarah Chen</B></TD></TR>
        <TR><TD ALIGN="CENTER" COLSPAN="2"><FONT COLOR="#718096">Engineering</FONT></TD></TR>
    </TABLE>>];

    VPProd [label=<<TABLE BORDER="1" CELLBORDER="0" CELLSPACING="0" BGCOLOR="#ffffff" COLOR="#cbd5e0">
        <TR><TD BGCOLOR="#319795" COLSPAN="2"><FONT COLOR="#ffffff"><B>VP of Product</B></FONT></TD></TR>
        <TR><TD ALIGN="CENTER" COLSPAN="2"><B>David Miller</B></TD></TR>
        <TR><TD ALIGN="CENTER" COLSPAN="2"><FONT COLOR="#718096">Product Mgmt</FONT></TD></TR>
    </TABLE>>];

    // Engineering Leads
    DevLead [label=<<TABLE BORDER="1" CELLBORDER="0" CELLSPACING="0" BGCOLOR="#ffffff" COLOR="#cbd5e0">
        <TR><TD BGCOLOR="#63b3ed" COLSPAN="2"><FONT COLOR="#ffffff"><B>Tech Lead (Dev)</B></FONT></TD></TR>
        <TR><TD ALIGN="CENTER" COLSPAN="2"><B>James Wilson</B></TD></TR>
        <TR><TD ALIGN="CENTER" COLSPAN="2"><FONT COLOR="#718096">Core Tech</FONT></TD></TR>
    </TABLE>>];

    QAHead [label=<<TABLE BORDER="1" CELLBORDER="0" CELLSPACING="0" BGCOLOR="#ffffff" COLOR="#cbd5e0">
        <TR><TD BGCOLOR="#63b3ed" COLSPAN="2"><FONT COLOR="#ffffff"><B>QA Lead</B></FONT></TD></TR>
        <TR><TD ALIGN="CENTER" COLSPAN="2"><B>Emma Watson</B></TD></TR>
        <TR><TD ALIGN="CENTER" COLSPAN="2"><FONT COLOR="#718096">Quality Ops</FONT></TD></TR>
    </TABLE>>];

    // Product Leads
    UXLead [label=<<TABLE BORDER="1" CELLBORDER="0" CELLSPACING="0" BGCOLOR="#ffffff" COLOR="#cbd5e0">
        <TR><TD BGCOLOR="#4fd1c5" COLSPAN="2"><FONT COLOR="#ffffff"><B>UX Design Lead</B></FONT></TD></TR>
        <TR><TD ALIGN="CENTER" COLSPAN="2"><B>Lisa Ray</B></TD></TR>
        <TR><TD ALIGN="CENTER" COLSPAN="2"><FONT COLOR="#718096">Design System</FONT></TD></TR>
    </TABLE>>];

    // Direct Reporting Relationships
    CEO -> VPEng [label="Direct Report"];
    CEO -> VPProd [label="Direct Report"];

    VPEng -> DevLead;
    VPEng -> QAHead;

    VPProd -> UXLead;
}
Instant Hierarchy Correction with VPasCode AI
Building extensive organizational charts across multiple departments can occasionally introduce script errors, such as unclosed HTML tags or malformed node names. Using VPasCode as your primary diagram-as-code platform provides 1-Click AI Code Error Fixing to instantly identify and resolve layout errors.
Whether you are designing matrix reporting charts, cross-functional project teams, or global corporate structures, an intelligent browser-based Graphviz editor ensures clean hierarchy visualization.
Best Practices for Graphviz Org Charts
To keep your organizational charts clear, professional, and easy to read across teams, follow these best practices:
- Standardize Color Coding: Assign distinct header background colors to different management tiers or functional departments for instant visual scanning.
- Keep Node Sizes Balanced: Maintain uniform padding and cell spacing in HTML-like tables so employee cards remain consistently proportioned throughout the graph.
- Export Scalable Assets: Render crisp SVG or PNG graphics straight from your browser-based Graphviz editor to embed in company wikis, HR portals, or publish online via Visual Paradigm OpenDocs integration.
Relying on a robust browser-based Graphviz editor supported by a full diagram-as-code platform equips managers and HR professionals to build clean, maintainable organizational charts with minimal effort.
Simplify Your Organizational Planning Today
Ready to transform your company structure text into publication-ready Org Charts? Try VPasCode’s feature-rich browser-based Graphviz editor today and experience instant 1-Click code error fixing, multi-format rendering, and seamless diagram-as-code capabilities.