


As enterprise codebases grow, understanding how packages, microservices, and internal modules interact becomes increasingly challenging. Tightly coupled architectures, circular imports, and hidden upstream dependencies can slow down feature development and introduce unexpected breaking changes during deployment. To maintain high code quality, engineering teams need clear visual architecture maps. Using a modern diagram-as-code platform allows developers to parse imports and render package relationships automatically. By generating graphs inside a browser-based Graphviz editor, software architects can analyze complex dependency hierarchies without drawing static canvas boxes by hand.
In this guide, we will explore how to visualize software architecture using Graphviz DOT language, how to identify tightly coupled modules, and how a unified diagram-as-code platform simplifies codebase documentation.
Why Map Software Dependencies with Graphviz DOT?
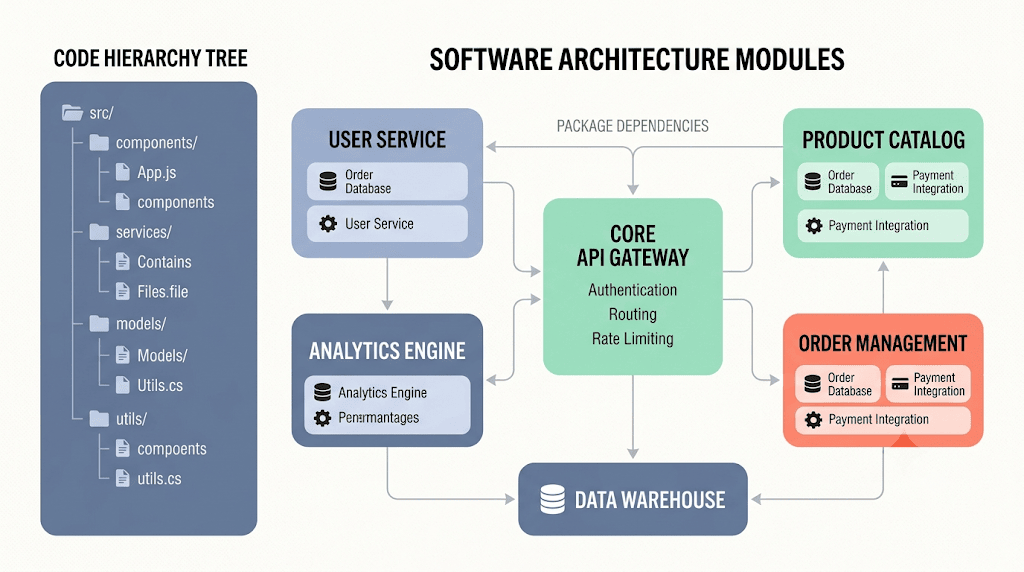
Manually tracking package imports across dozens of directories in traditional drawing tools is inefficient and prone to error. Whenever a module is refactored, static diagrams immediately drift out of sync with the underlying repository. Converting import statements into text-based graph scripts provides an automated, repeatable solution.
Using a flexible browser-based Graphviz editor for dependency mapping offers several critical engineering benefits:
- Automated Structural Layout: The
dotengine automatically arranges hierarchical trees, placing core utility libraries at the bottom and high-level controllers at the top. - Version-Controlled Architecture: Store dependency definitions as plain text DOT files alongside your codebase in Git to track structural changes over time.
- Instant Architectural Insights: Highlight circular dependencies, orphaned packages, and high-risk central libraries using custom node styles and directional edges.
Adopting a robust diagram-as-code platform ensures that your technical documentation evolves smoothly alongside your software refactoring efforts.
Building a Codebase Dependency Graph Step-by-Step
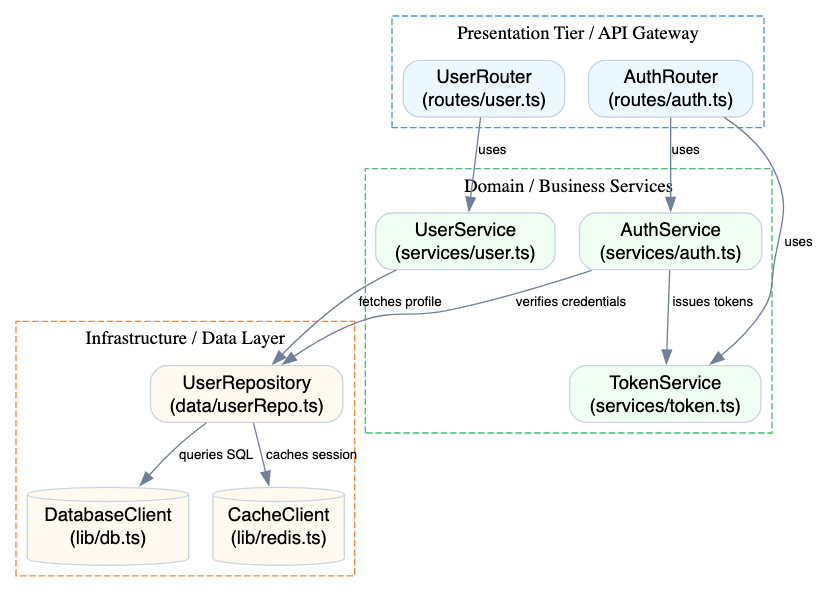
Let’s examine how to model a modular web application architecture—including API gateways, authentication services, business logic controllers, data mappers, and external database clients—using DOT syntax. Below is a practical code example you can copy and test directly in your browser-based Graphviz editor:
Dependency Graph Code Example (Try it Now):
digraph CodebaseDependencies {
    rankdir=TB;
    node [shape=box, style="filled,rounded", fillcolor="#edf2f7", fontname="Helvetica", color="#cbd5e0"];
    edge [color="#718096", fontname="Helvetica", fontsize=10];

    // Presentation Layer
    subgraph cluster_presentation {
        label="Presentation Tier / API Gateway";
        style=dashed;
        color="#4299e1";
        AuthRouter [label="AuthRouter\n(routes/auth.ts)", fillcolor="#ebf8ff"];
        UserRouter [label="UserRouter\n(routes/user.ts)", fillcolor="#ebf8ff"];
    }

    // Domain & Business Logic Tier
    subgraph cluster_domain {
        label="Domain / Business Services";
        style=dashed;
        color="#48bb78";
        AuthService [label="AuthService\n(services/auth.ts)", fillcolor="#f0fff4"];
        UserService [label="UserService\n(services/user.ts)", fillcolor="#f0fff4"];
        TokenService [label="TokenService\n(services/token.ts)", fillcolor="#f0fff4"];
    }

    // Infrastructure & Persistence Tier
    subgraph cluster_infrastructure {
        label="Infrastructure / Data Layer";
        style=dashed;
        color="#ed8936";
        UserRepository [label="UserRepository\n(data/userRepo.ts)", fillcolor="#fffaf0"];
        DatabaseClient [label="DatabaseClient\n(lib/db.ts)", fillcolor="#fffaf0", shape=cylinder];
        CacheClient [label="CacheClient\n(lib/redis.ts)", fillcolor="#fffaf0", shape=cylinder];
    }

    // Code Base Dependencies (Imports)
    AuthRouter -> AuthService [label="uses"];
    AuthRouter -> TokenService [label="uses"];
    UserRouter -> UserService [label="uses"];

    AuthService -> TokenService [label="issues tokens"];
    AuthService -> UserRepository [label="verifies credentials"];
    UserService -> UserRepository [label="fetches profile"];

    UserRepository -> DatabaseClient [label="queries SQL"];
    UserRepository -> CacheClient [label="caches session"];
}
Streamlining Syntax and Debugging with VPasCode AI
When mapping massive codebases containing hundreds of interrelated files, manually writing or maintaining large DOT scripts can introduce syntax errors, broken node declarations, or misconfigured subgraph structures. Utilizing VPasCode as your central diagram-as-code platform provides your development team with integrated 1-Click AI Code Error Fixing to identify and resolve formatting glitches instantly.
Whether you are documenting class inheritance, analyzing microservice communication patterns, or generating dependency graphs, an intelligent browser-based Graphviz editor eliminates syntax friction so you can focus on system architecture.
Best Practices for Dependency Graph Documentation
To maximize readability and keep software architecture diagrams effective for onboardings, technical reviews, and audits, keep these core practices in mind:
- Organize Code Layers into Subgraphs: Group modules logically by tier (such as presentation, business logic, and infrastructure) within
subgraph cluster_*blocks to clearly delineate architectural boundaries. - Color-Code High-Impact Libraries: Apply distinct fill colors to core shared utilities or legacy modules to highlight critical single-point-of-failure dependencies.
- Export High-Resolution Diagrams: Render crisp vector assets directly from your browser-based Graphviz editor to publish in developer documentation or share online via Visual Paradigm OpenDocs integration.
Relying on an intuitive browser-based Graphviz editor powered by a complete diagram-as-code platform enables software architects and engineering managers to maintain high-quality, up-to-date codebase maps effortlessly.
Master Your Codebase Dependencies Today
Ready to gain full visibility into your software architecture and map complex code dependencies from text in seconds? Try VPasCode’s powerful browser-based Graphviz editor today and experience instant 1-Click code error fixing, multi-format rendering, and seamless diagram-as-code capabilities.