


VPasCode is a browser-based diagram-as-code platform that combines a text editor, live rendering, multiple diagram languages, and AI-assisted generation and editing. It supports PlantUML, Mermaid, Graphviz, D2, and additional formats in one workspace. The platform can generate diagram code from natural-language prompts, modify existing code, help diagnose syntax errors, translate labels, and export diagrams as SVG, PNG, or PDF.
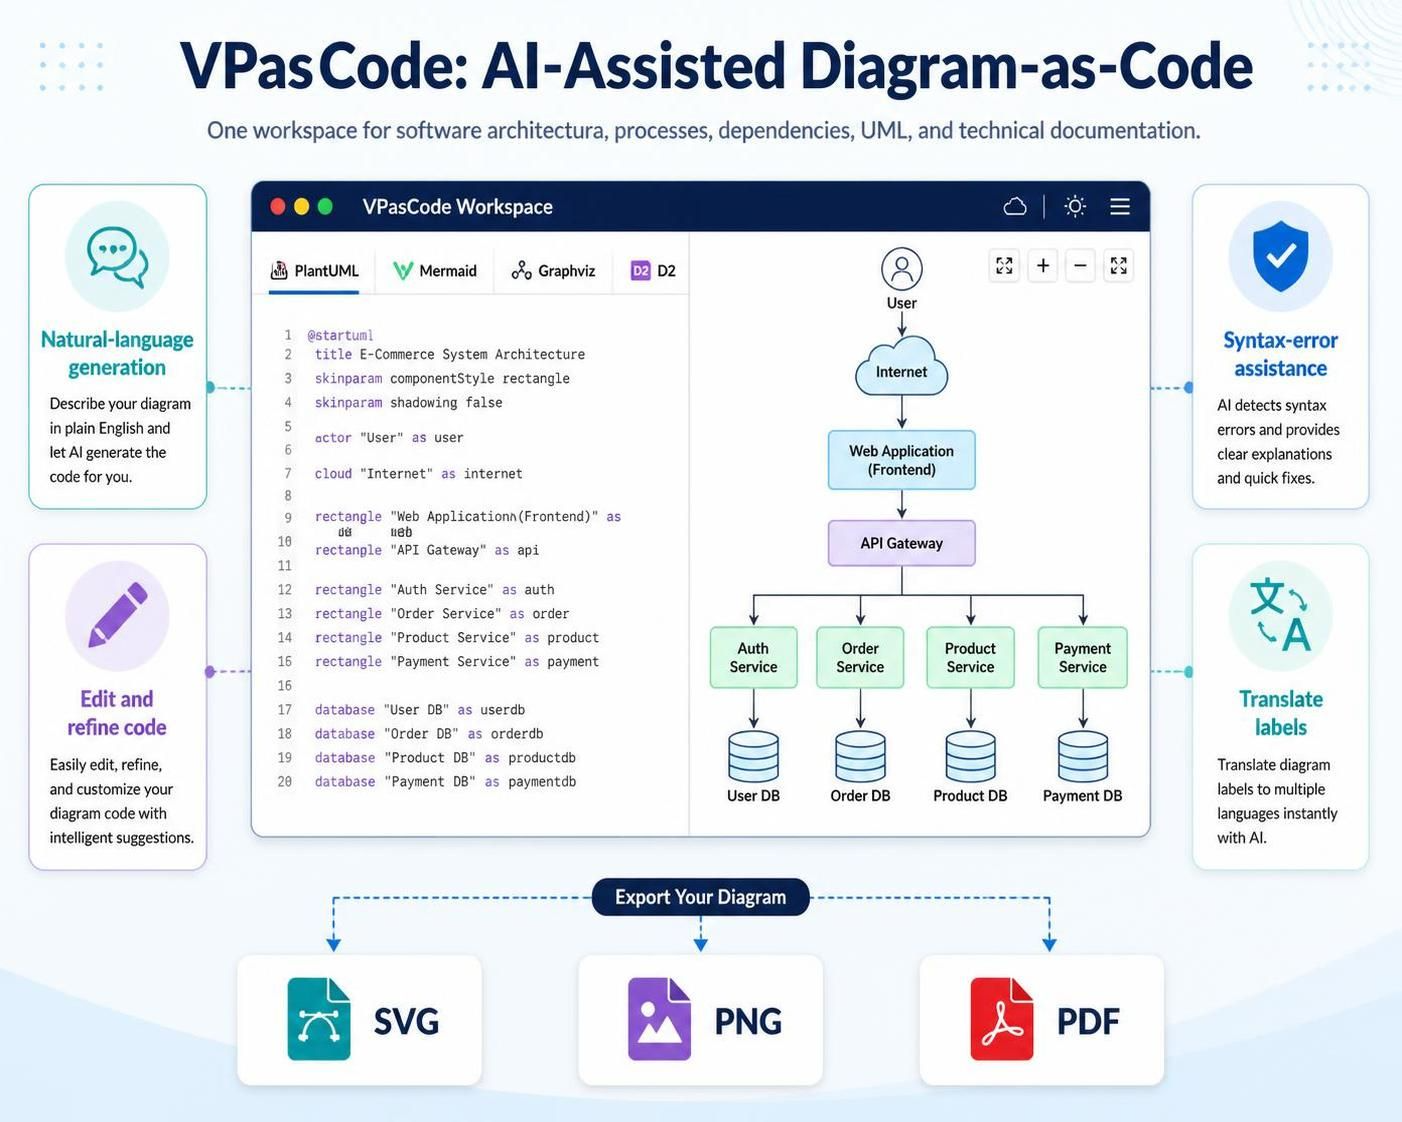
This guide explains how to use VPasCode as an AI-assisted modeling workflow for software architecture, processes, dependencies, UML, and technical documentation.
1. What Is Diagram-as-Code?
Diagram-as-code is the practice of defining a diagram with text rather than manually dragging shapes onto a canvas.
Instead of:
-
Adding shapes manually
-
Connecting them with lines
-
Repositioning them after every change
-
Exporting a static image
you maintain a text file that describes the diagram:
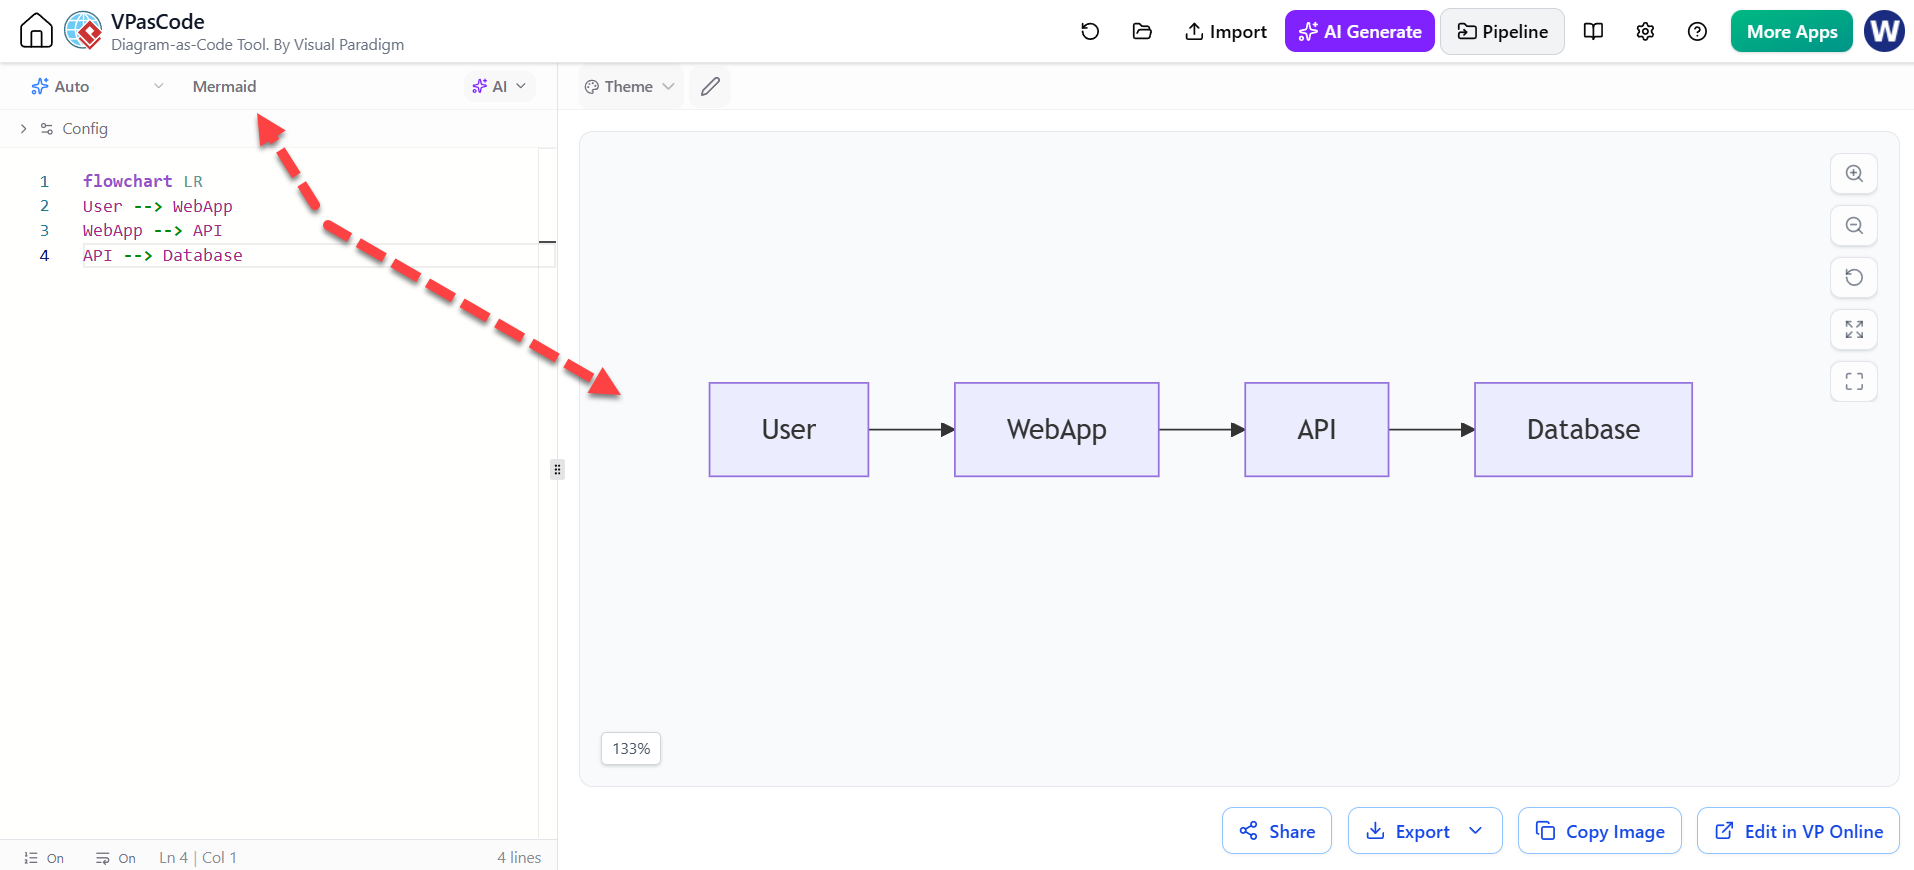
flowchart LR
    User --> WebApp
    WebApp --> API
    API --> Database
The diagram is then generated automatically by a rendering engine.
This approach provides several advantages:
-
Diagram source can be stored in Git.
-
Changes can be reviewed as text diffs.
-
Diagrams can be regenerated consistently.
-
AI can create or modify the source code.
-
Documentation can be updated alongside application code.
-
The same model can often be exported into multiple formats.
-
Large diagrams are easier to refactor than manually drawn diagrams.
VPasCode provides a unified editor and live preview for several diagram-as-code standards, reducing the need to switch between separate tools.
2. Why Add AI to Diagram-as-Code?
Traditional diagram-as-code is efficient once you know the syntax, but it can still require:
-
Learning language-specific grammar
-
Remembering layout and styling options
-
Debugging syntax errors
-
Converting between diagram formats
-
Keeping diagrams readable as they grow
-
Translating labels for different audiences
AI can assist at each stage:
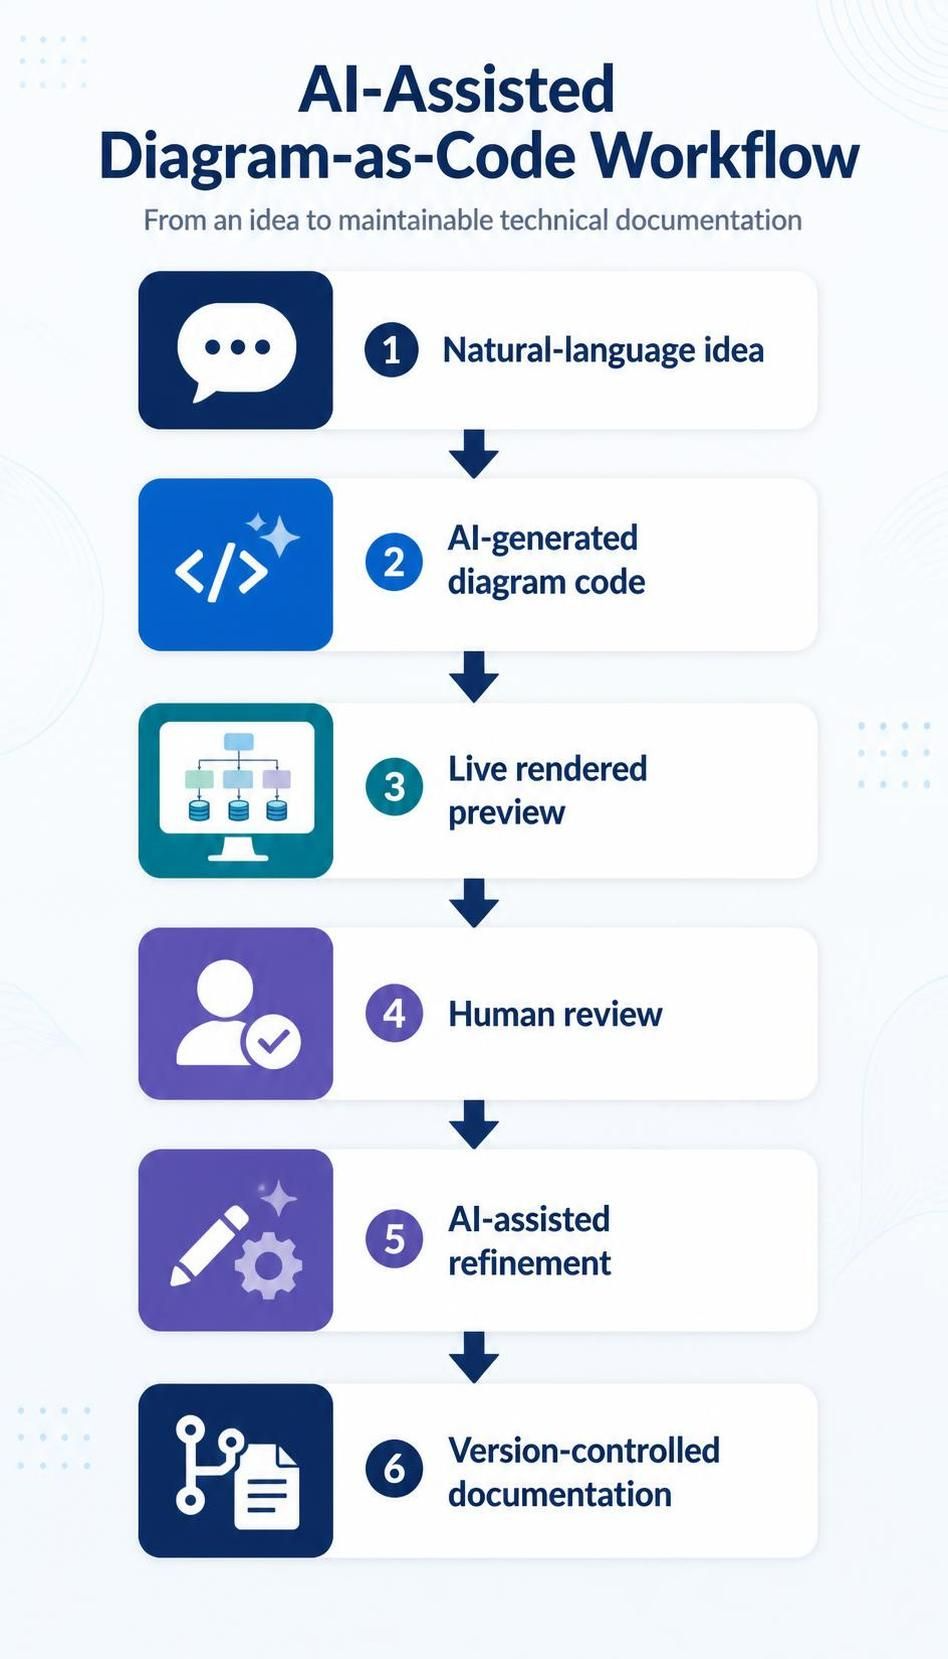
Natural-language idea
        ↓
AI-generated diagram code
        ↓
Live rendered preview
        ↓
Human review
        ↓
AI-assisted refinement
        ↓
Version-controlled documentation
For example, you can prompt:
Create a Mermaid architecture diagram for an e-commerce system with a browser client, API gateway, product service, order service, payment provider, message queue, and PostgreSQL database. Show synchronous and asynchronous communication.
The AI can produce an initial Mermaid script, which you can immediately inspect and refine in the VPasCode editor.
AI features described for VPasCode include natural-language diagram generation, modification of existing scripts, syntax-error assistance, and translation of diagram labels. Availability of advanced AI capabilities may depend on the Visual Paradigm edition or subscription.
3. The Role of VPasCode
VPasCode is useful as a central workspace for three related activities:
Authoring
Write or paste PlantUML, Mermaid, Graphviz, or other supported diagram code.
Rendering
View a live diagram preview while editing the source.
AI-assisted refinement
Ask AI to:
-
Create a diagram from a description
-
Add or remove components
-
Rename nodes
-
Change diagram orientation
-
Group related services
-
Add system boundaries
-
Simplify a crowded diagram
-
Convert one diagram syntax into another
-
Fix syntax problems
-
Translate visible labels
VPasCode also supports automatic format detection when diagram code is pasted into the editor, according to the platform documentation.
4. Choosing the Right Diagram Language
PlantUML, Mermaid, and Graphviz overlap in some areas, but they are optimized for different use cases.
| Technology | Best suited for | Main strengths | Typical diagrams |
|---|---|---|---|
| PlantUML | Formal UML and software architecture | Rich notation, UML support, C4 modeling, precise relationships | Class, sequence, use case, activity, component, deployment, C4 |
| Mermaid | Documentation and lightweight diagrams | Concise syntax, Markdown compatibility, broad diagram coverage | Flowcharts, sequence, state, ERD, Git graphs, timelines, Gantt |
| Graphviz | Graphs and dependency networks | Powerful automatic layout and relationship modeling | Dependency graphs, directed graphs, hierarchies, topology, data flow |
VPasCode lists PlantUML support for UML, C4, network, ERD, and related diagram types; Mermaid support for flowcharts, sequence diagrams, class diagrams, state diagrams, Gantt charts, timelines, and more; and Graphviz support for directed graphs, standard graphs, organization charts, clusters, and data-flow diagrams.
Practical selection rules
Use Mermaid when:
-
The diagram will live inside Markdown documentation.
-
You need a quick flowchart or sequence diagram.
-
Your audience includes developers who prefer simple syntax.
-
You want a diagram embedded in a documentation site.
Use PlantUML when:
-
You need UML semantics.
-
You are modeling classes, components, deployment, or interactions.
-
You need C4 architecture diagrams.
-
You want more control over UML-specific concepts.
Use Graphviz when:
-
The central concept is a graph of relationships.
-
You need dependency analysis.
-
You are visualizing a hierarchy or network.
-
Automatic layout is more important than UML notation.
5. Getting Started with VPasCode
A typical workflow is:
-
Open the VPasCode editor in a browser.
-
Select a diagram language or paste existing code.
-
Write or generate the diagram source.
-
Review the live preview.
-
Use AI to refine the source where appropriate.
-
Validate the diagram against the real system.
-
Export the result or store the source in version control.
The core editor, live rendering, and export functionality are described as available in the free VPasCode experience, while some advanced AI features may require a qualifying edition.
Start with a clear diagram objective
Before asking AI to generate a diagram, define what the diagram should explain.
Good objectives include:
-
Show how a user logs in.
-
Explain the relationship between services.
-
Show the deployment topology.
-
Describe an order approval workflow.
-
Identify dependencies between packages.
-
Communicate the system boundary to stakeholders.
Avoid prompts such as:
Create a diagram of the entire company platform.
Prefer:
Create a system-context diagram showing customers, the online store, the payment provider, and the notification service. Do not include internal implementation details.
A diagram should generally answer one primary question.
6. AI Prompting for Diagram Generation
AI-generated diagrams are most useful when the prompt specifies:
-
The target language
-
The diagram type
-
The system or process being modeled
-
The actors or components
-
Relationships between elements
-
Direction of flow
-
Desired level of detail
-
Audience
-
Styling or layout requirements
General prompt template
Create a [diagram type] using [Mermaid/PlantUML/Graphviz].

Purpose:
[What question should the diagram answer?]

Include:
- [Element 1]
- [Element 2]
- [Element 3]

Relationships:
- [Relationship 1]
- [Relationship 2]

Constraints:
- Keep the diagram readable.
- Use short labels.
- Group related components.
- Do not invent components that were not specified.
- Return only valid [language] code.
Example: architecture prompt
Create a Mermaid flowchart for an online bookstore.

Include:
- Customer browser
- Web application
- API gateway
- Catalog service
- Order service
- Payment provider
- PostgreSQL database
- Notification queue
- Email service

Show:
- Product browsing
- Order submission
- Payment processing
- Asynchronous order notifications

Use left-to-right layout. Group backend services in a subgraph. Keep labels concise.
Example: UML prompt
Create a PlantUML sequence diagram for user login.

Participants:
- User
- Browser
- Authentication API
- Identity Provider
- User Database

Flow:
1. User submits credentials.
2. Browser sends credentials to the Authentication API.
3. Authentication API validates them with the Identity Provider.
4. The Identity Provider reads user data.
5. The API returns a session token.
6. The browser displays the authenticated home page.

Include an alternative flow for invalid credentials.
Example: dependency prompt
Create a Graphviz DOT dependency graph for these services:

- Frontend depends on APIGateway.
- APIGateway depends on UserService and OrderService.
- OrderService depends on PaymentService and OrderDatabase.
- UserService depends on UserDatabase.

Use a left-to-right layout and visually distinguish databases from services.
7. Mermaid in VPasCode
Mermaid is well suited for lightweight, documentation-friendly diagrams. Its syntax is compact and readable, making it a good starting point for AI-generated diagrams.
7.1 Mermaid flowchart
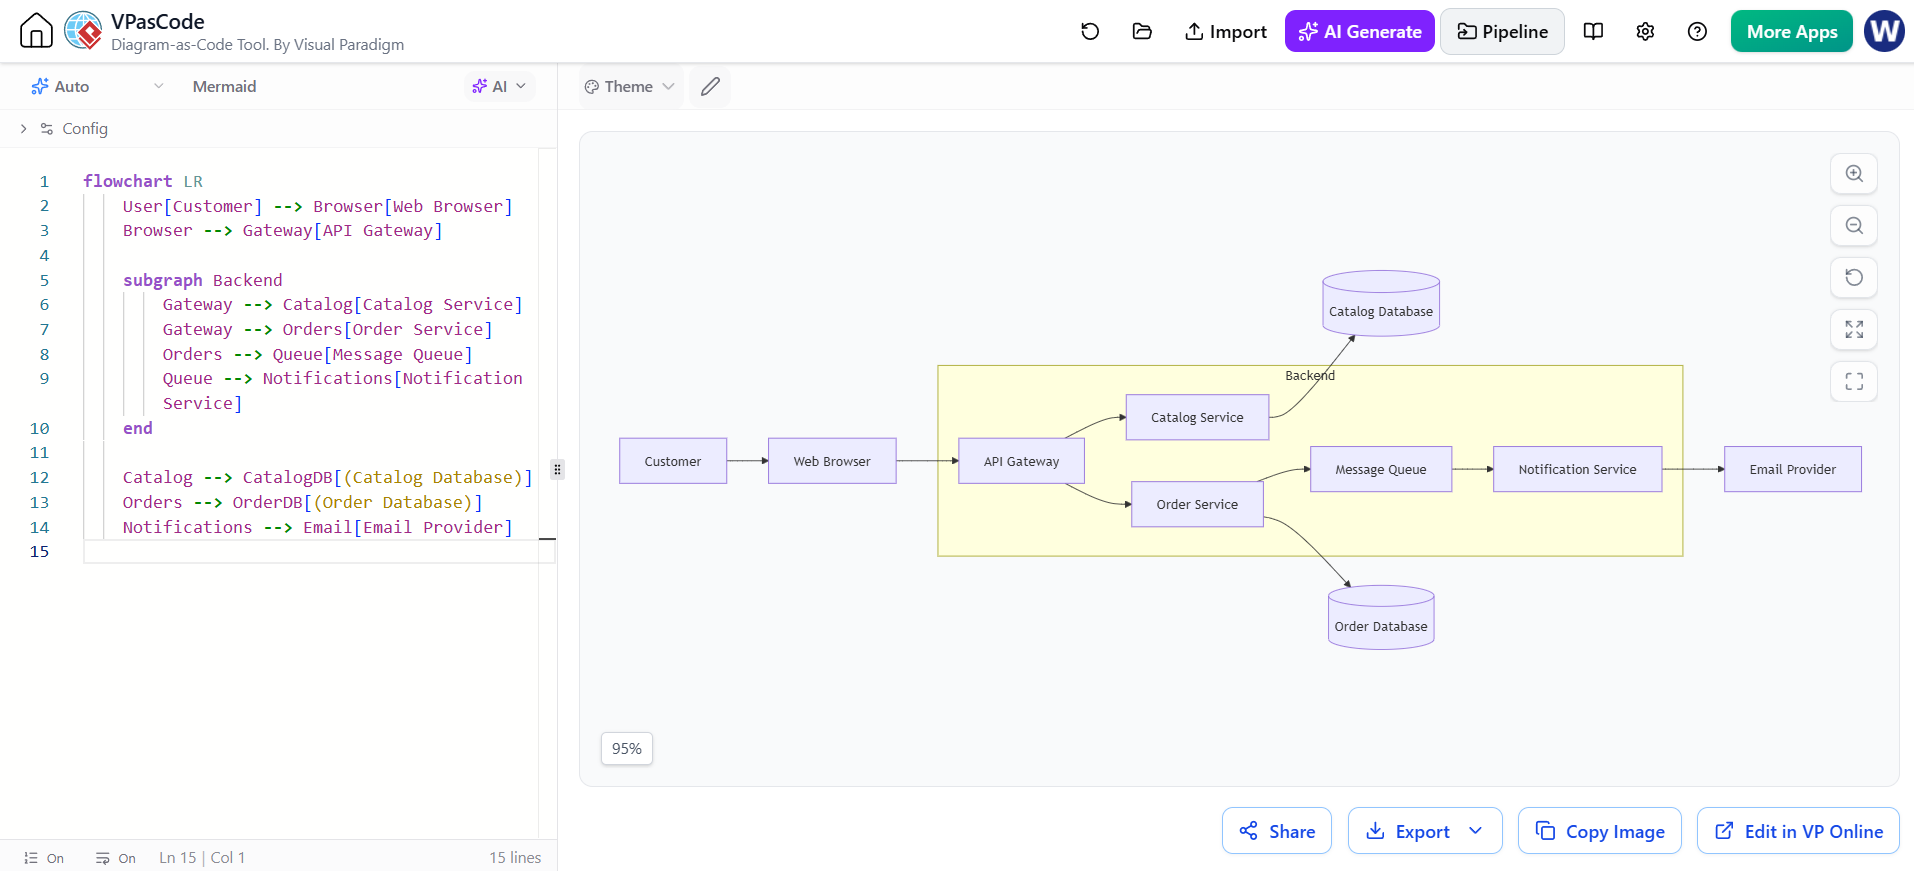
flowchart LR
    User[Customer] --> Browser[Web Browser]
    Browser --> Gateway[API Gateway]

    subgraph Backend
        Gateway --> Catalog[Catalog Service]
        Gateway --> Orders[Order Service]
        Orders --> Queue[Message Queue]
        Queue --> Notifications[Notification Service]
    end

    Catalog --> CatalogDB[(Catalog Database)]
    Orders --> OrderDB[(Order Database)]
    Notifications --> Email[Email Provider]
This diagram communicates:
-
User entry point
-
Main application boundary
-
Backend services
-
Data stores
-
Asynchronous messaging
-
External email integration
7.2 Mermaid sequence diagram
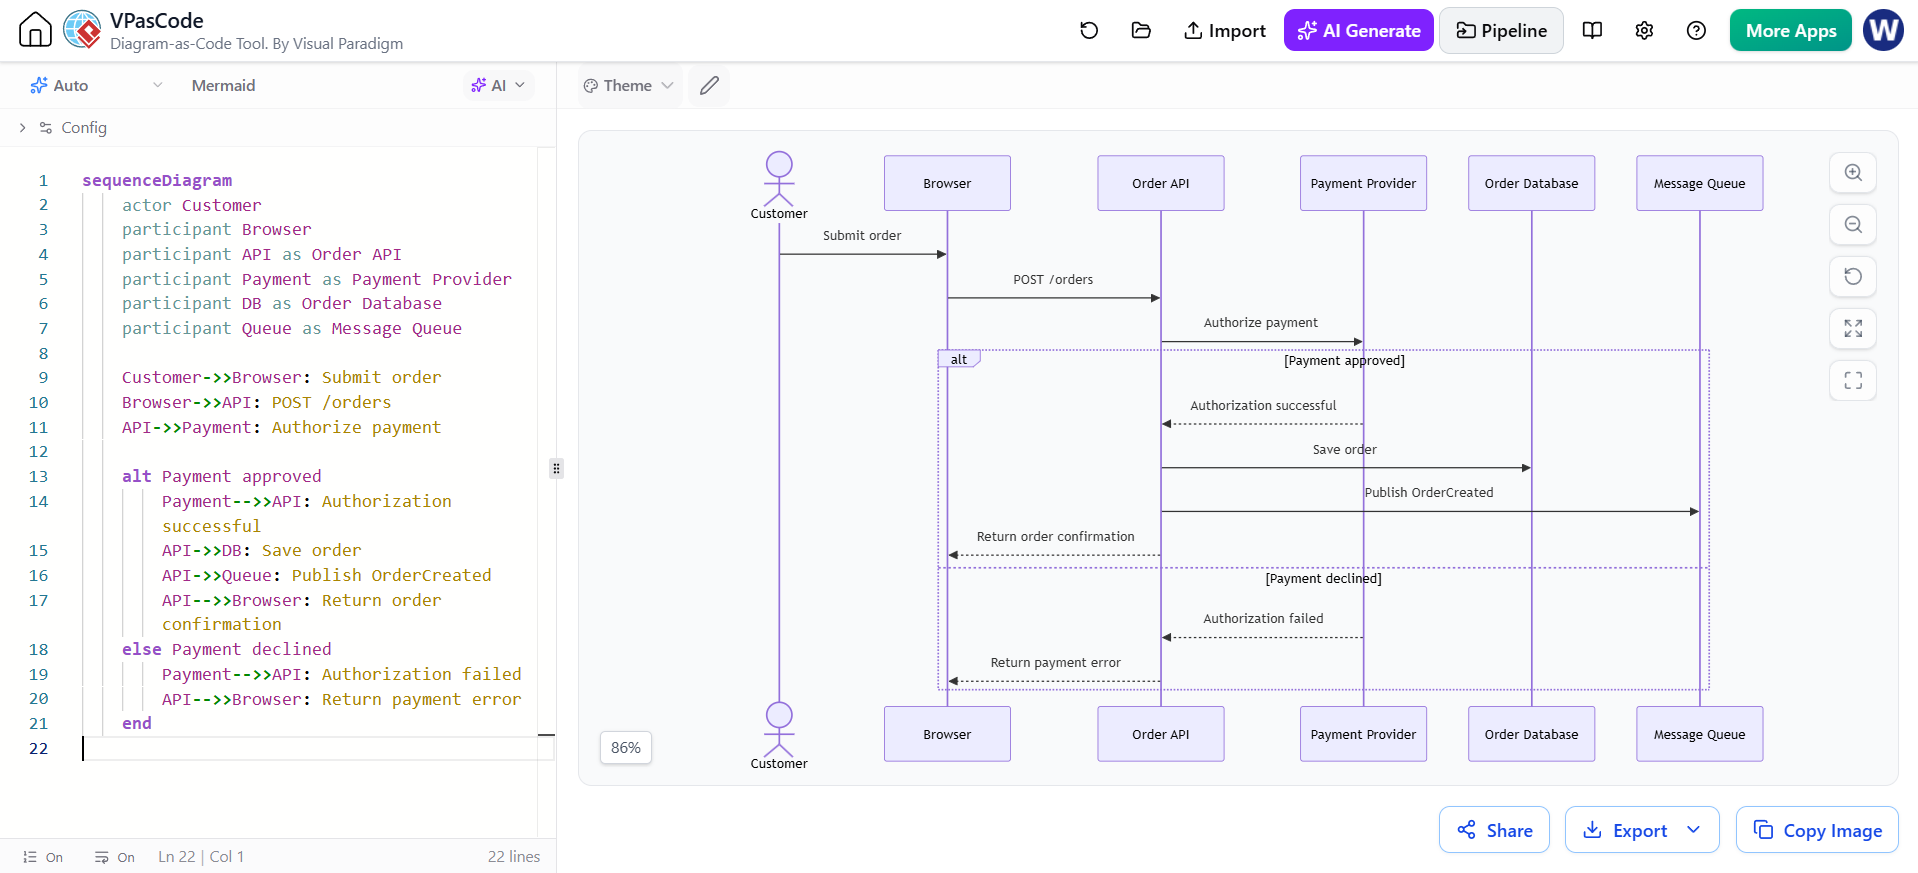
sequenceDiagram
    actor Customer
    participant Browser
    participant API as Order API
    participant Payment as Payment Provider
    participant DB as Order Database
    participant Queue as Message Queue

    Customer->>Browser: Submit order
    Browser->>API: POST /orders
    API->>Payment: Authorize payment

    alt Payment approved
        Payment-->>API: Authorization successful
        API->>DB: Save order
        API->>Queue: Publish OrderCreated
        API-->>Browser: Return order confirmation
    else Payment declined
        Payment-->>API: Authorization failed
        API-->>Browser: Return payment error
    end
Use Mermaid sequence diagrams when the primary concern is message order rather than static structure.
7.3 Mermaid state diagram
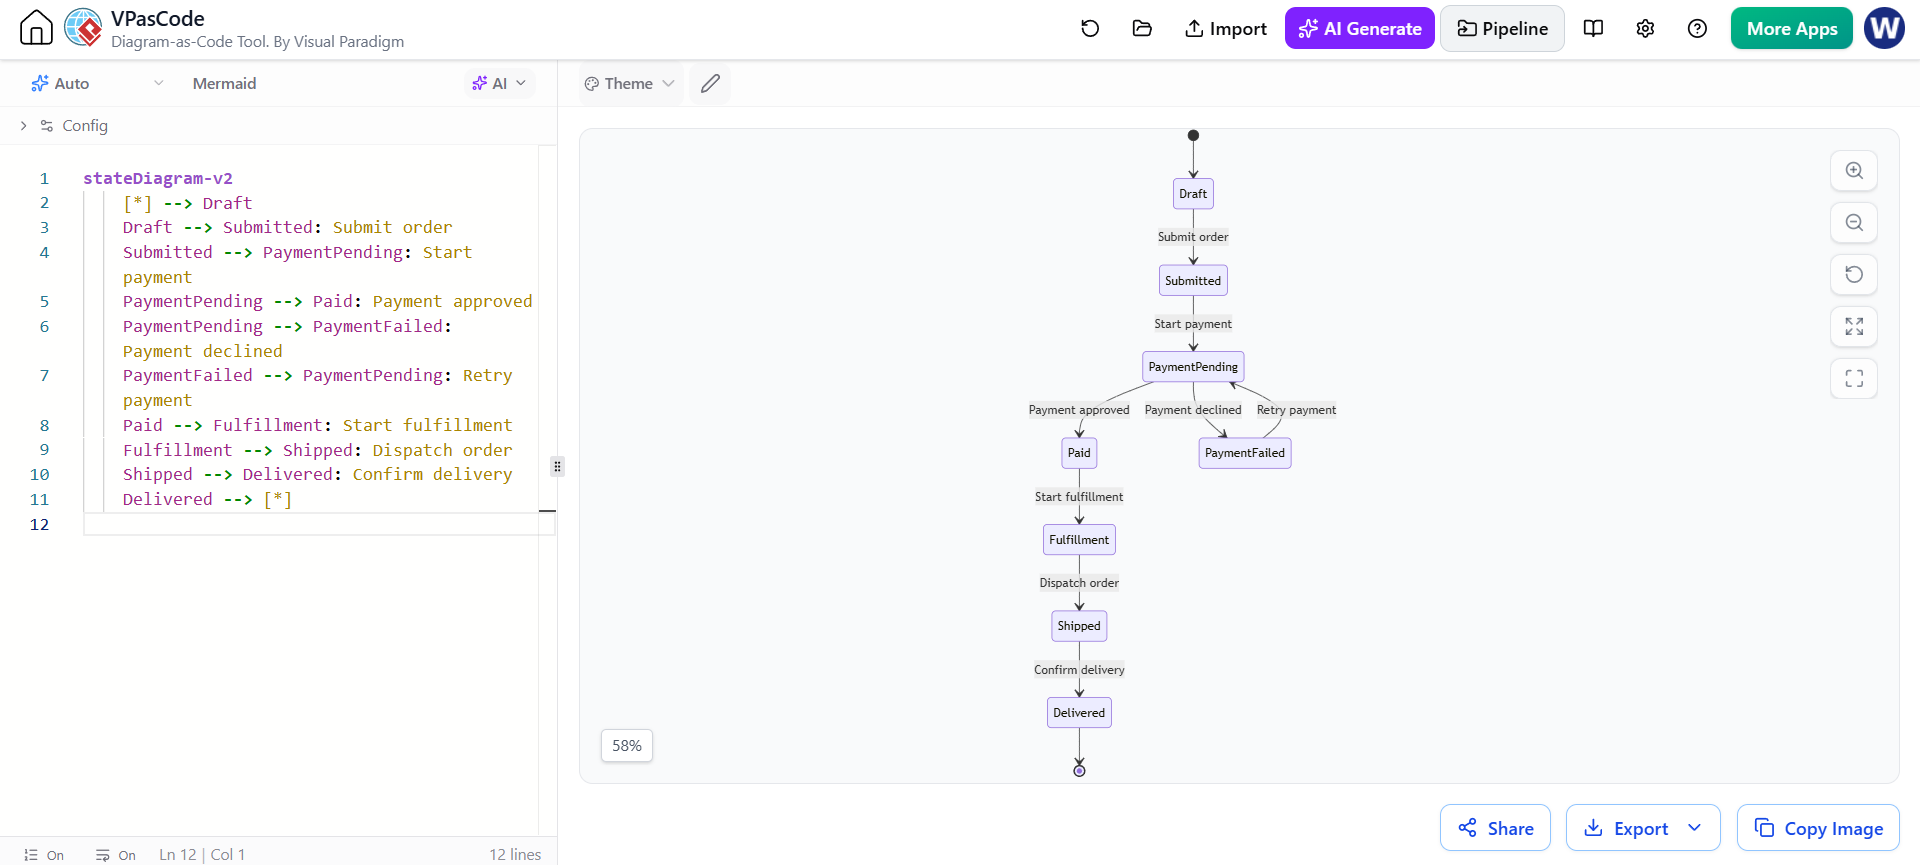
stateDiagram-v2
    [*] --> Draft
    Draft --> Submitted: Submit order
    Submitted --> PaymentPending: Start payment
    PaymentPending --> Paid: Payment approved
    PaymentPending --> PaymentFailed: Payment declined
    PaymentFailed --> PaymentPending: Retry payment
    Paid --> Fulfillment: Start fulfillment
    Fulfillment --> Shipped: Dispatch order
    Shipped --> Delivered: Confirm delivery
    Delivered --> [*]
7.4 Mermaid entity-relationship diagram
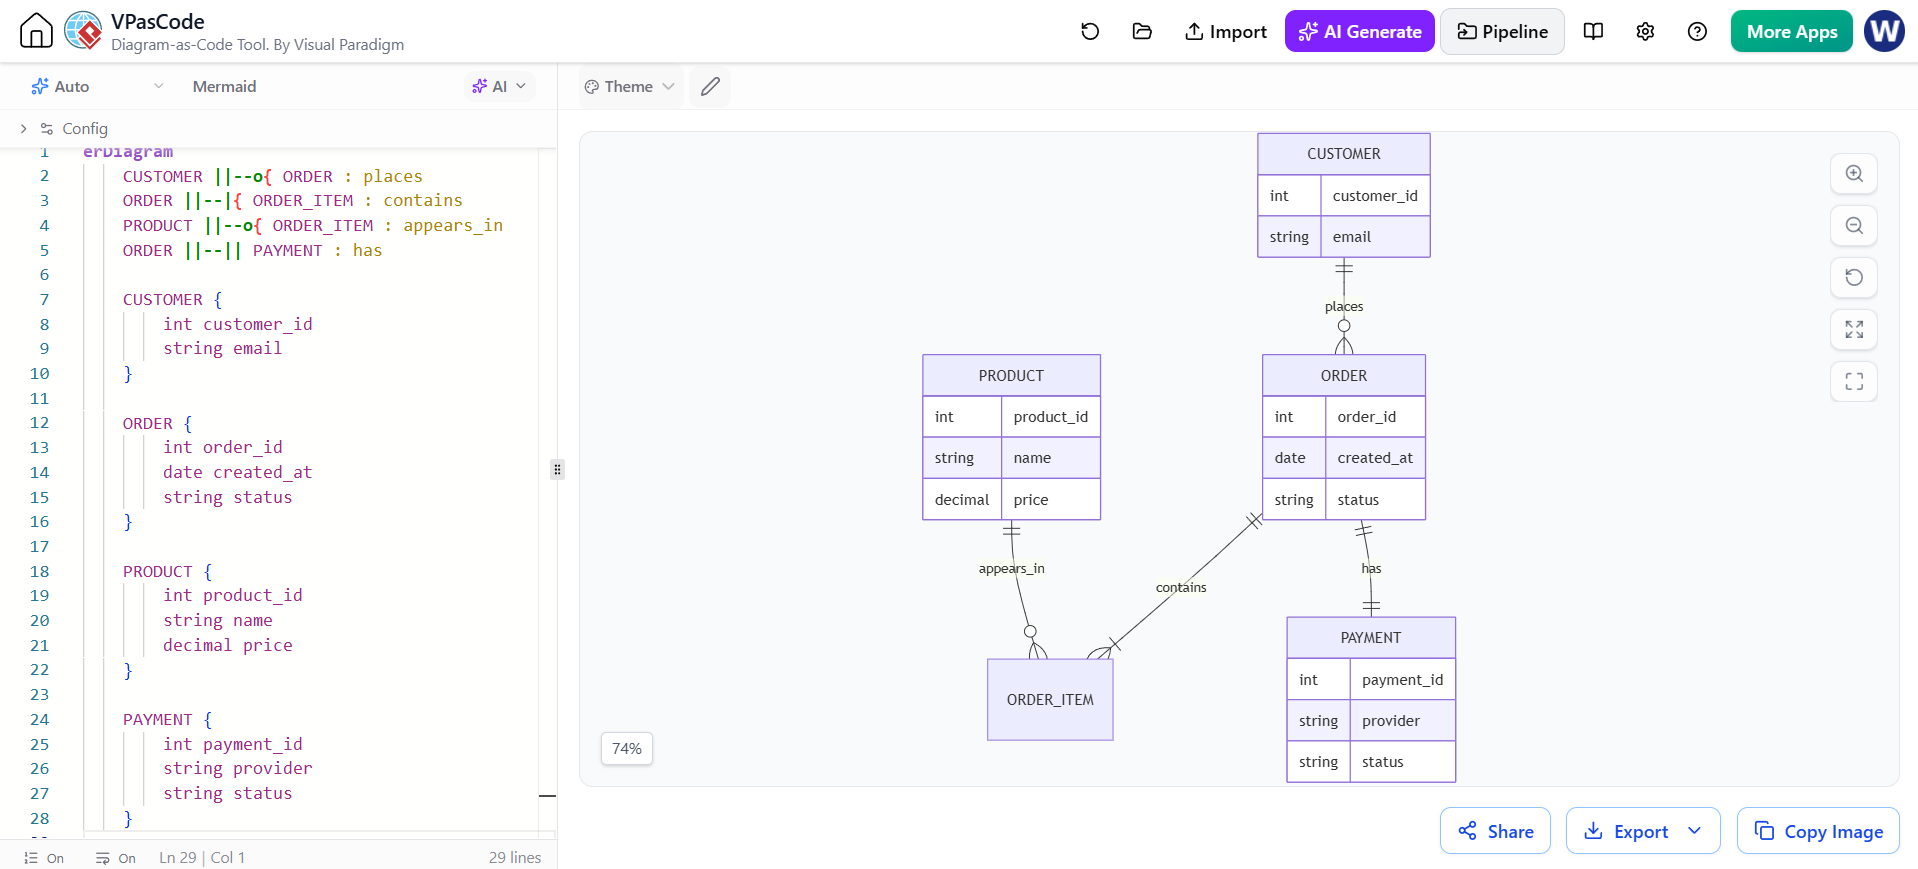
erDiagram
    CUSTOMER ||--o{ ORDER : places
    ORDER ||--|{ ORDER_ITEM : contains
    PRODUCT ||--o{ ORDER_ITEM : appears_in
    ORDER ||--|| PAYMENT : has

    CUSTOMER {
        int customer_id
        string email
    }

    ORDER {
        int order_id
        date created_at
        string status
    }

    PRODUCT {
        int product_id
        string name
        decimal price
    }

    PAYMENT {
        int payment_id
        string provider
        string status
    }
Mermaid best practices
-
Keep node labels short.
-
Use subgraphs to group related components.
-
Avoid putting every implementation detail into one diagram.
-
Use a consistent direction such as
LRorTB. -
Split large diagrams by concern.
-
Use sequence diagrams for behavior and flowcharts for structure or decisions.
-
Use comments to document unusual relationships where supported.
8. PlantUML in VPasCode
PlantUML is a strong choice for formal software modeling and UML-based architecture documentation.
8.1 PlantUML component diagram
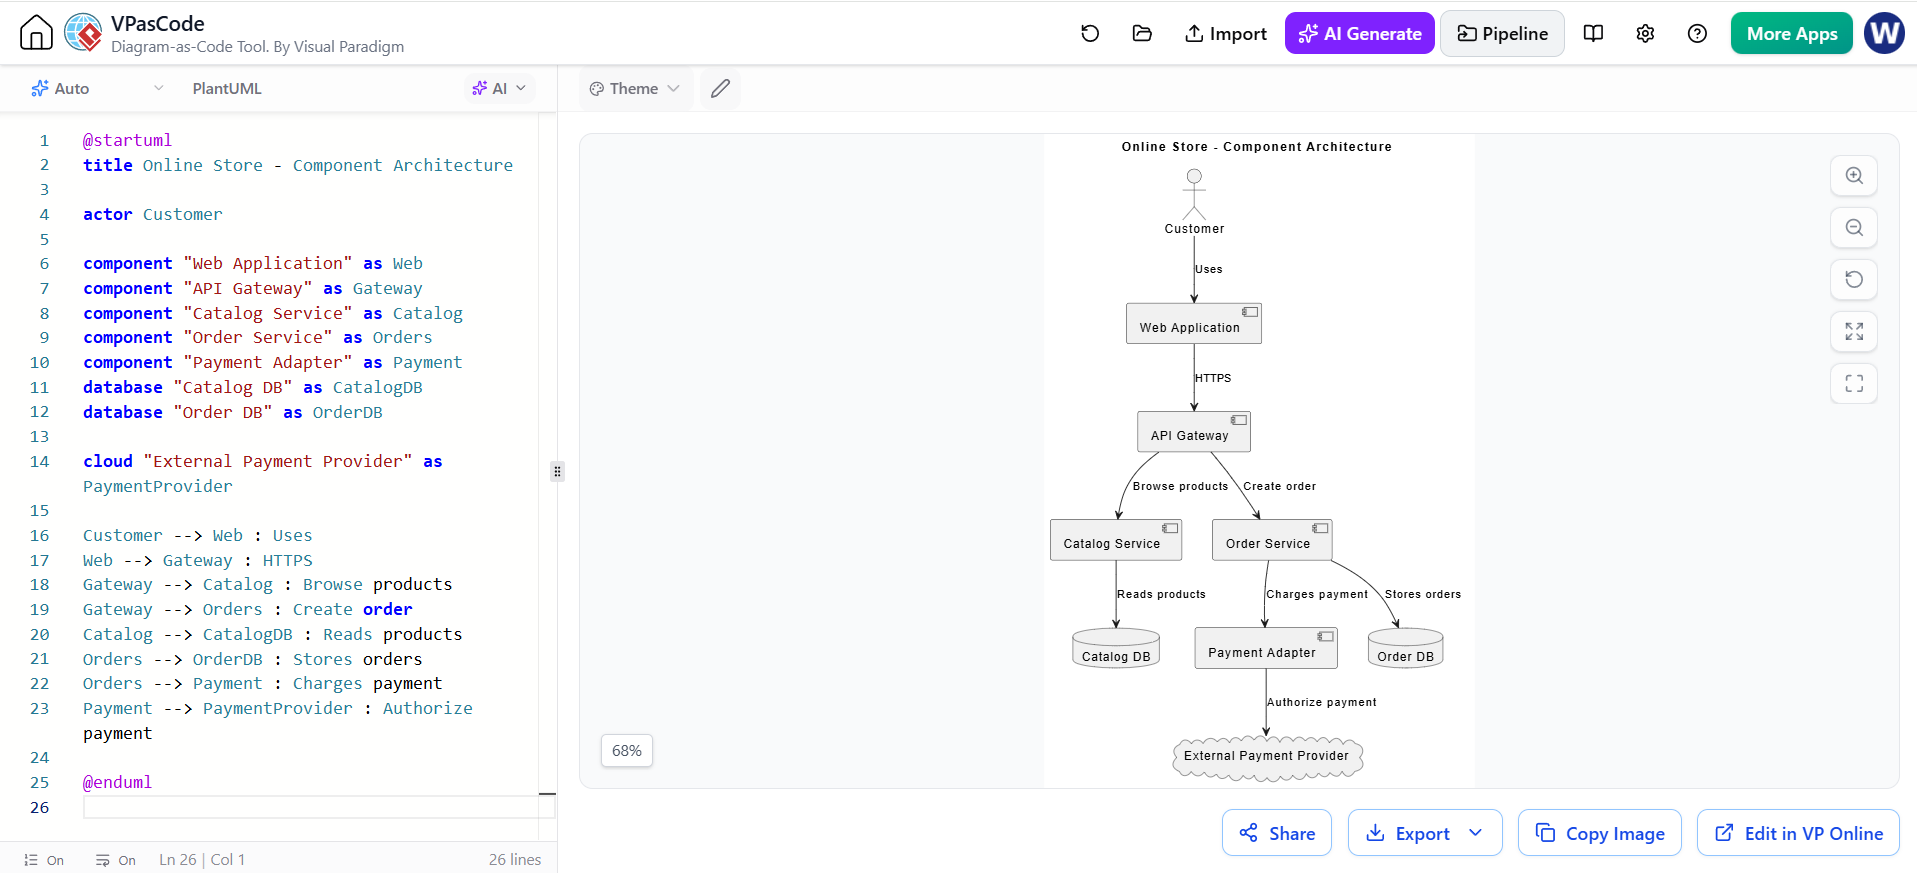
@startuml
title Online Store - Component Architecture

actor Customer

component "Web Application" as Web
component "API Gateway" as Gateway
component "Catalog Service" as Catalog
component "Order Service" as Orders
component "Payment Adapter" as Payment
database "Catalog DB" as CatalogDB
database "Order DB" as OrderDB

cloud "External Payment Provider" as PaymentProvider

Customer --> Web : Uses
Web --> Gateway : HTTPS
Gateway --> Catalog : Browse products
Gateway --> Orders : Create order
Catalog --> CatalogDB : Reads products
Orders --> OrderDB : Stores orders
Orders --> Payment : Charges payment
Payment --> PaymentProvider : Authorize payment

@enduml
PlantUML is useful when you need components, actors, databases, and explicit relationships in a UML-oriented notation.
8.2 PlantUML sequence diagram
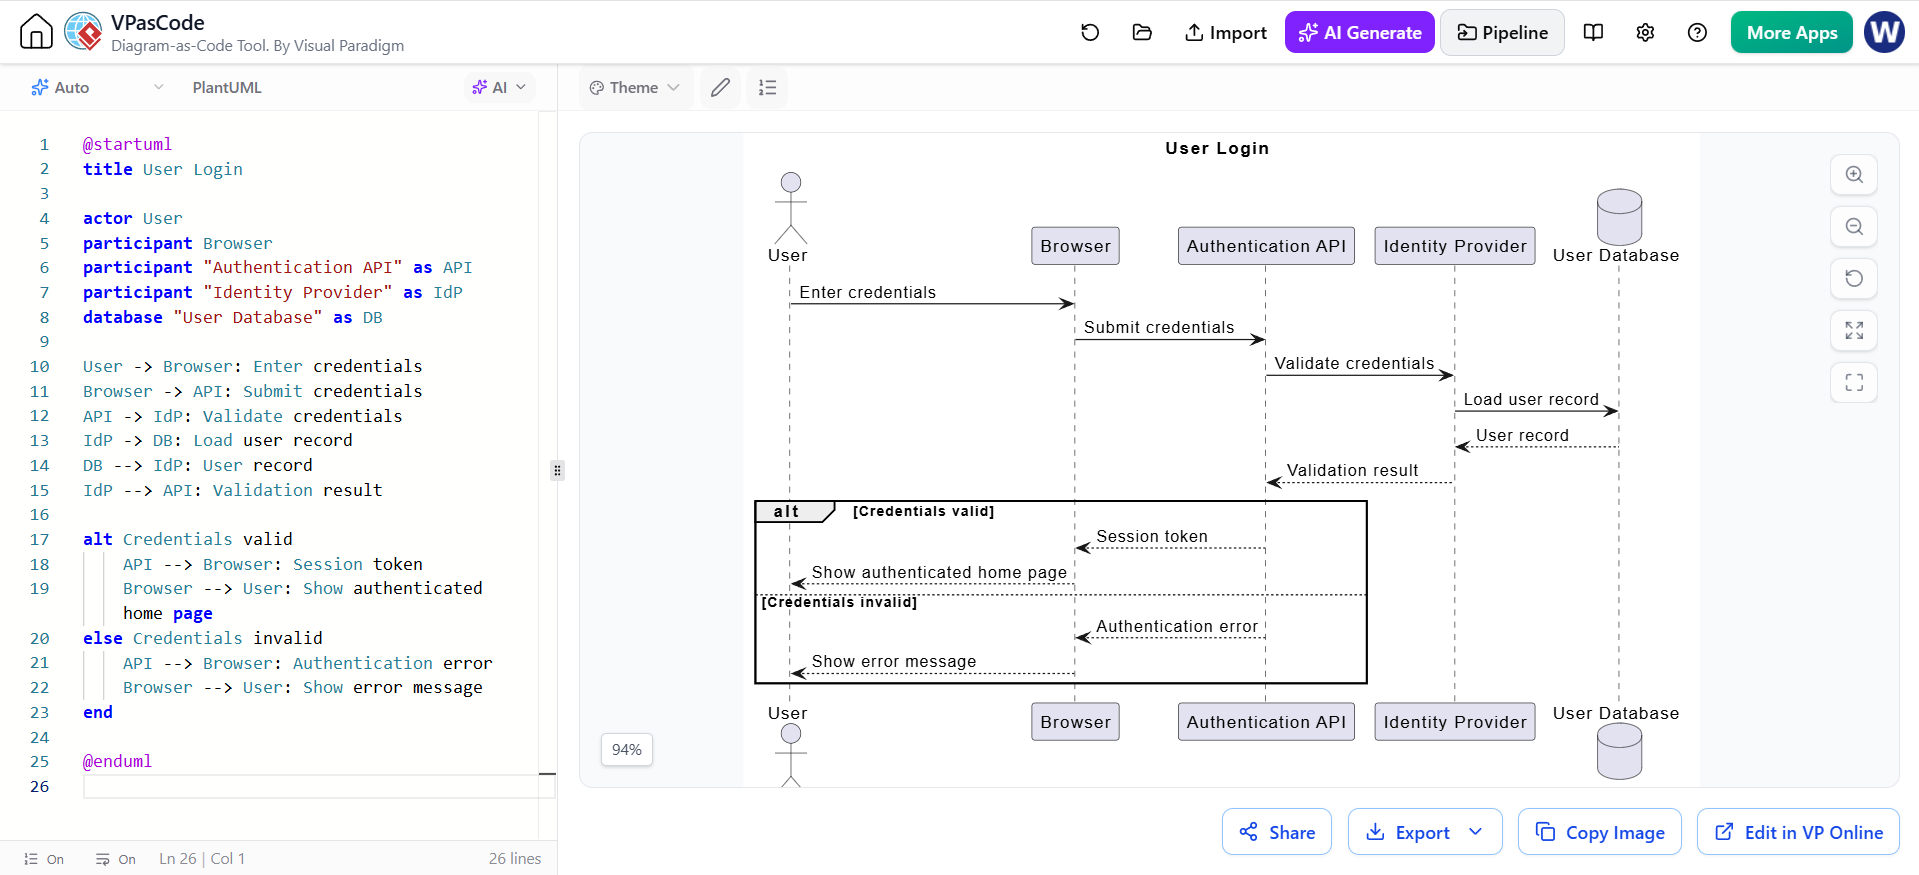
@startuml
title User Login

actor User
participant Browser
participant "Authentication API" as API
participant "Identity Provider" as IdP
database "User Database" as DB

User -> Browser: Enter credentials
Browser -> API: Submit credentials
API -> IdP: Validate credentials
IdP -> DB: Load user record
DB --> IdP: User record
IdP --> API: Validation result

alt Credentials valid
    API --> Browser: Session token
    Browser --> User: Show authenticated home page
else Credentials invalid
    API --> Browser: Authentication error
    Browser --> User: Show error message
end

@enduml
PlantUML’s sequence syntax is particularly suitable for documenting request lifecycles, authentication, payment workflows, and service interactions.
8.3 PlantUML C4 system-context diagram
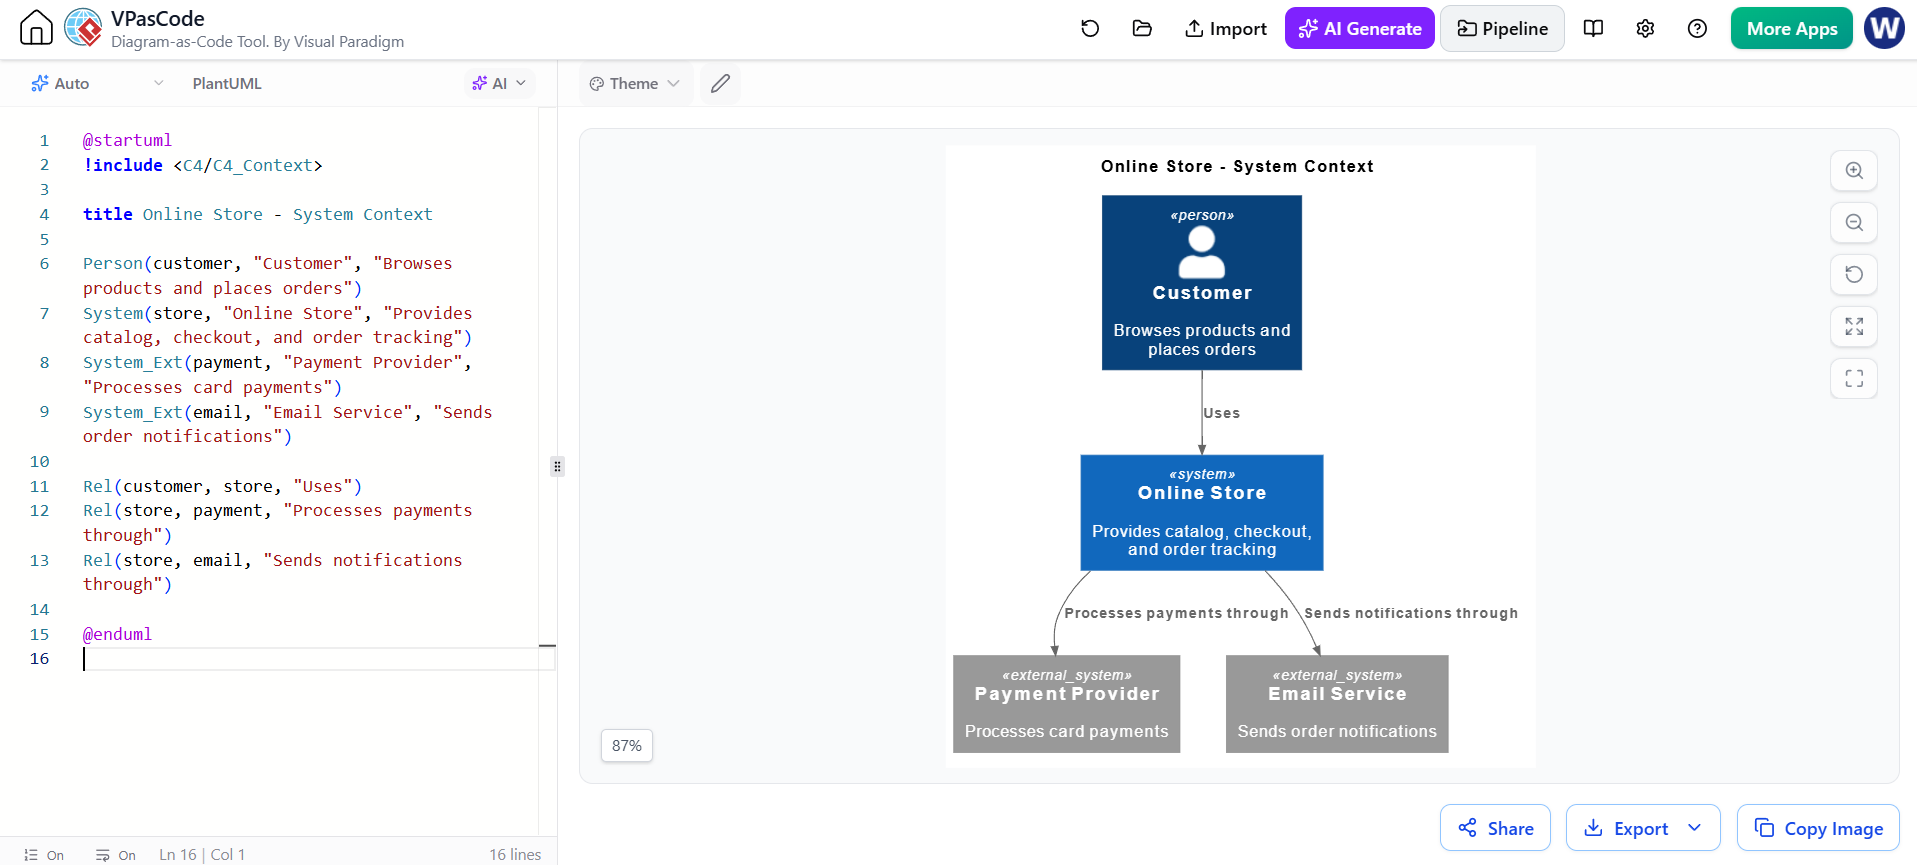
@startuml
!include <C4/C4_Context>

title Online Store - System Context

Person(customer, "Customer", "Browses products and places orders")
System(store, "Online Store", "Provides catalog, checkout, and order tracking")
System_Ext(payment, "Payment Provider", "Processes card payments")
System_Ext(email, "Email Service", "Sends order notifications")

Rel(customer, store, "Uses")
Rel(store, payment, "Processes payments through")
Rel(store, email, "Sends notifications through")

@enduml
C4 diagrams are useful for communicating architecture at different abstraction levels:
-
System context
-
Container
-
Component
-
Code
For executive or stakeholder communication, start with a system-context or container diagram rather than a detailed class diagram.
8.4 PlantUML class diagram
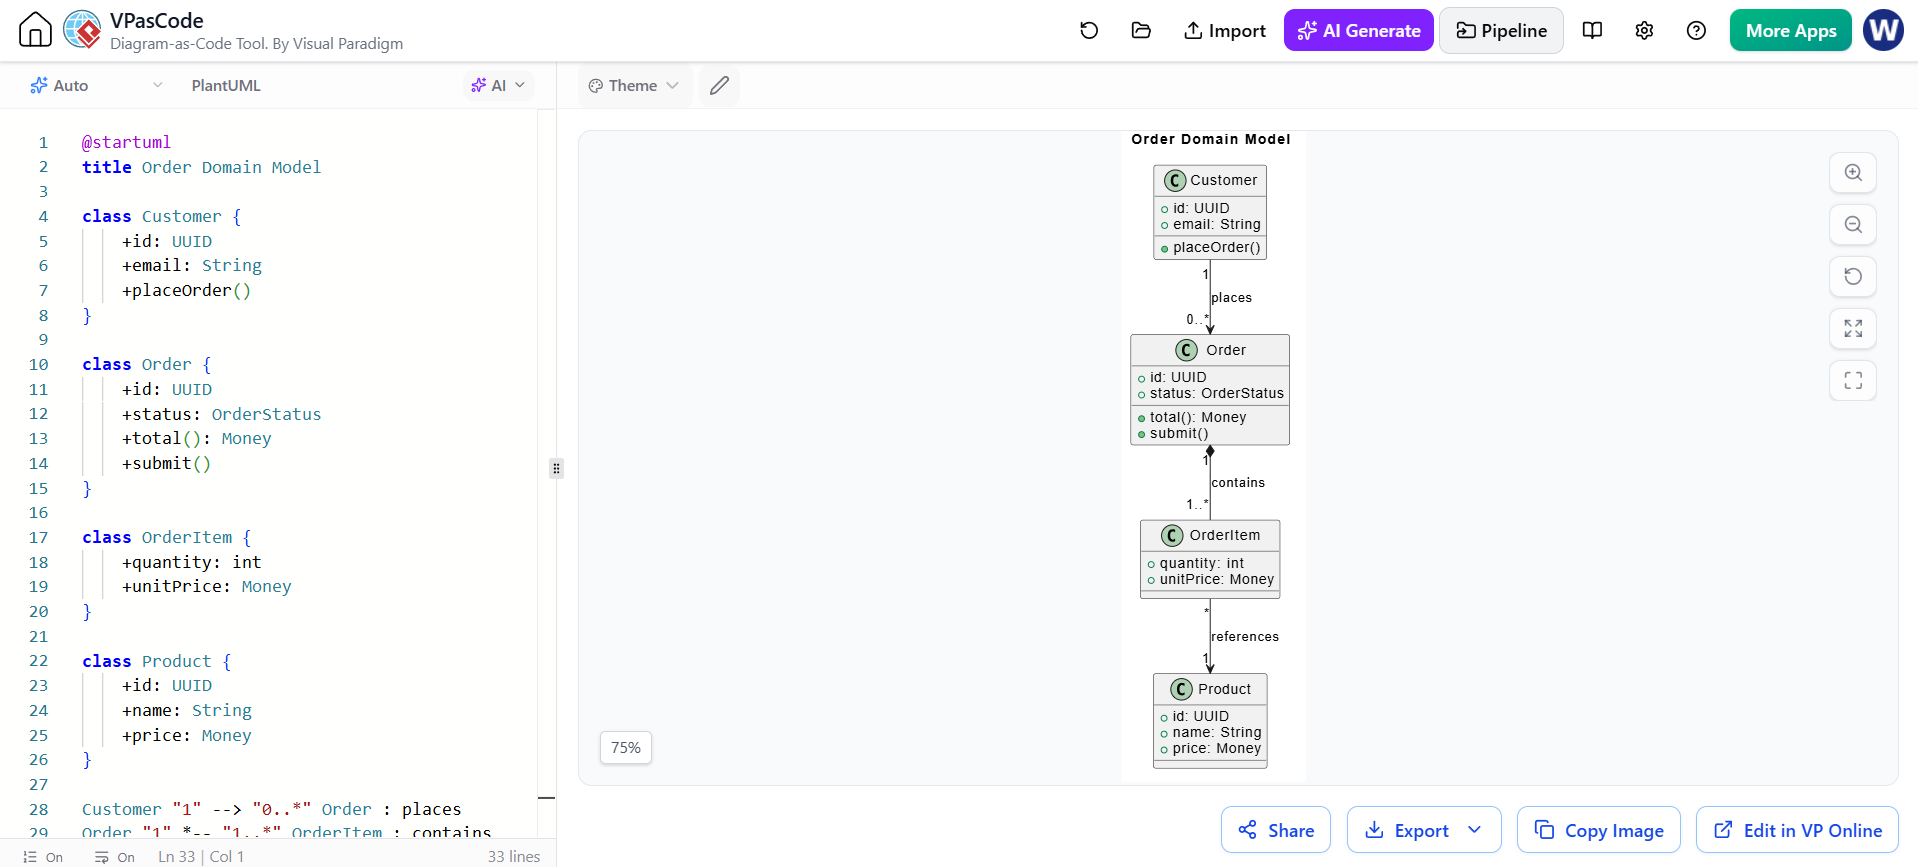
@startuml
title Order Domain Model

class Customer {
    +id: UUID
    +email: String
    +placeOrder()
}

class Order {
    +id: UUID
    +status: OrderStatus
    +total(): Money
    +submit()
}

class OrderItem {
    +quantity: int
    +unitPrice: Money
}

class Product {
    +id: UUID
    +name: String
    +price: Money
}

Customer "1" --> "0..*" Order : places
Order "1" *-- "1..*" OrderItem : contains
OrderItem "*" --> "1" Product : references

@enduml
PlantUML best practices
-
Use C4 for architecture communication.
-
Use component diagrams for service boundaries.
-
Use sequence diagrams for runtime interactions.
-
Use class diagrams for domain or code structure.
-
Keep implementation details out of high-level diagrams.
-
Use meaningful relationship labels.
-
Use boundaries to show ownership and system scope.
-
Avoid showing every class, endpoint, and database table in one diagram.
9. Graphviz in VPasCode
Graphviz uses the DOT language to describe nodes and edges. It is especially useful for dependency networks, directed graphs, hierarchies, and topology diagrams.
9.1 Graphviz dependency graph
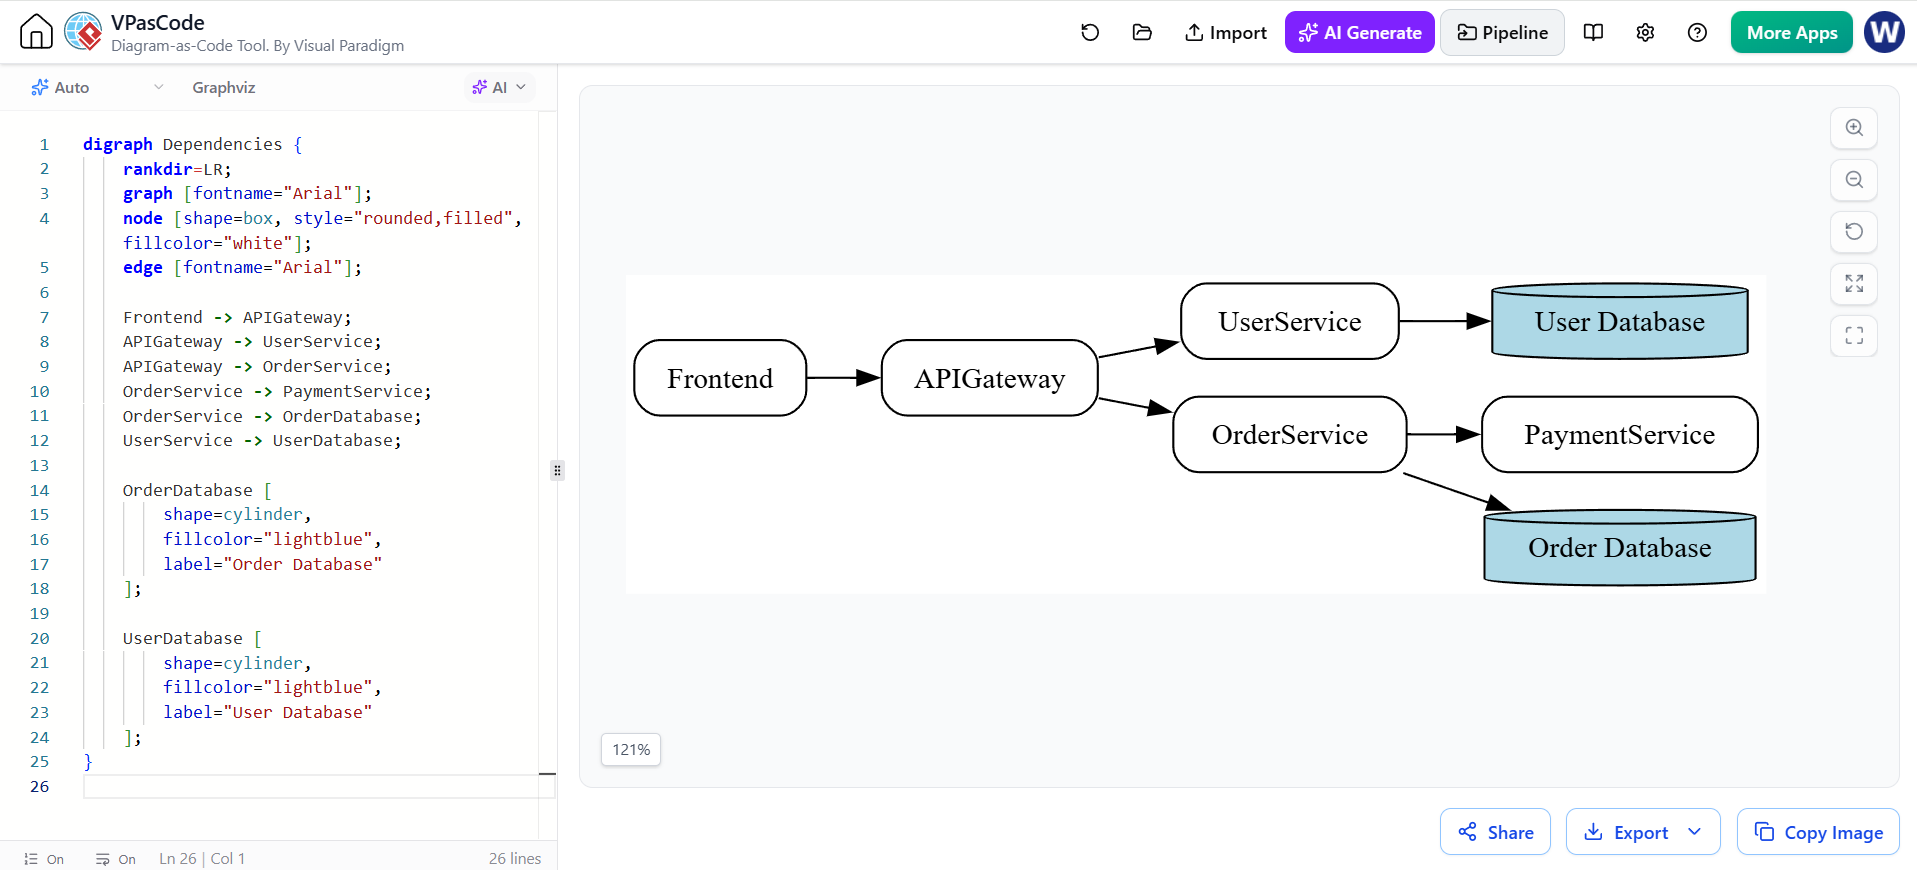
digraph Dependencies {
    rankdir=LR;
    graph [fontname="Arial"];
    node [shape=box, style="rounded,filled", fillcolor="white"];
    edge [fontname="Arial"];

    Frontend -> APIGateway;
    APIGateway -> UserService;
    APIGateway -> OrderService;
    OrderService -> PaymentService;
    OrderService -> OrderDatabase;
    UserService -> UserDatabase;

    OrderDatabase [
        shape=cylinder,
        fillcolor="lightblue",
        label="Order Database"
    ];

    UserDatabase [
        shape=cylinder,
        fillcolor="lightblue",
        label="User Database"
    ];
}
This type of graph can help identify:
-
Highly depended-on services
-
Long dependency chains
-
Central integration points
-
Potential coupling problems
-
Database ownership
-
Architectural bottlenecks
9.2 Graphviz clustered architecture
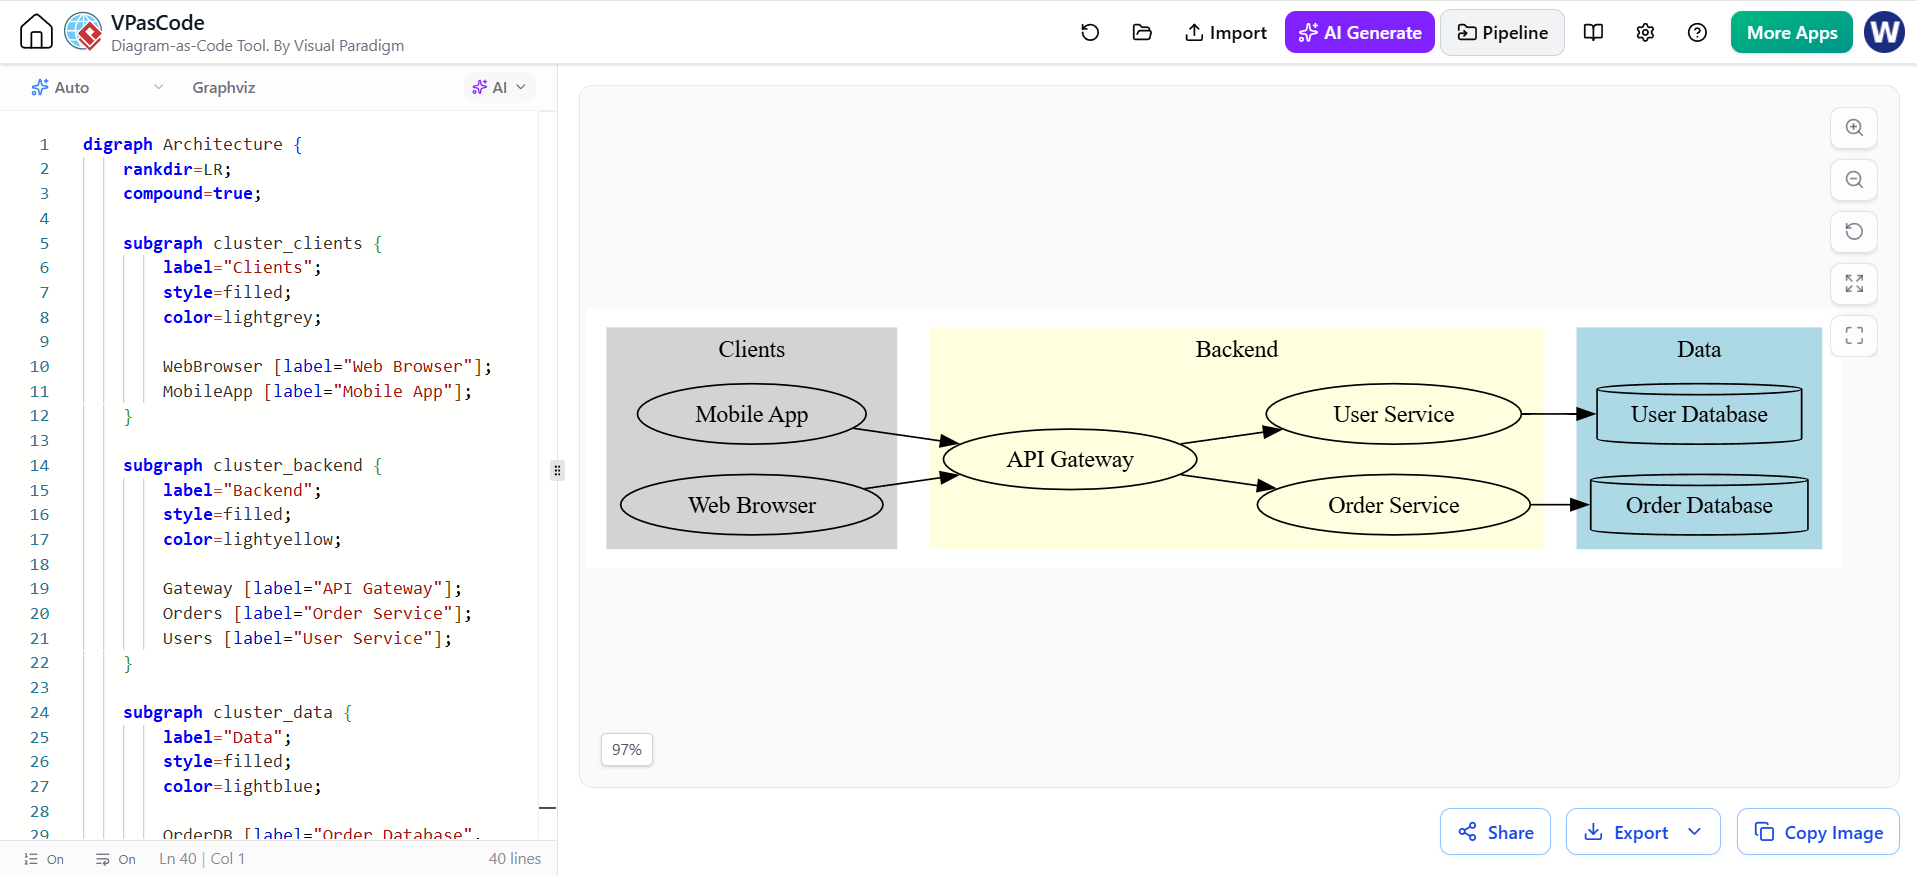
digraph Architecture {
    rankdir=LR;
    compound=true;

    subgraph cluster_clients {
        label="Clients";
        style=filled;
        color=lightgrey;

        WebBrowser [label="Web Browser"];
        MobileApp [label="Mobile App"];
    }

    subgraph cluster_backend {
        label="Backend";
        style=filled;
        color=lightyellow;

        Gateway [label="API Gateway"];
        Orders [label="Order Service"];
        Users [label="User Service"];
    }

    subgraph cluster_data {
        label="Data";
        style=filled;
        color=lightblue;

        OrderDB [label="Order Database", shape=cylinder];
        UserDB [label="User Database", shape=cylinder];
    }

    WebBrowser -> Gateway;
    MobileApp -> Gateway;
    Gateway -> Orders;
    Gateway -> Users;
    Orders -> OrderDB;
    Users -> UserDB;
}
9.3 Graphviz hierarchy
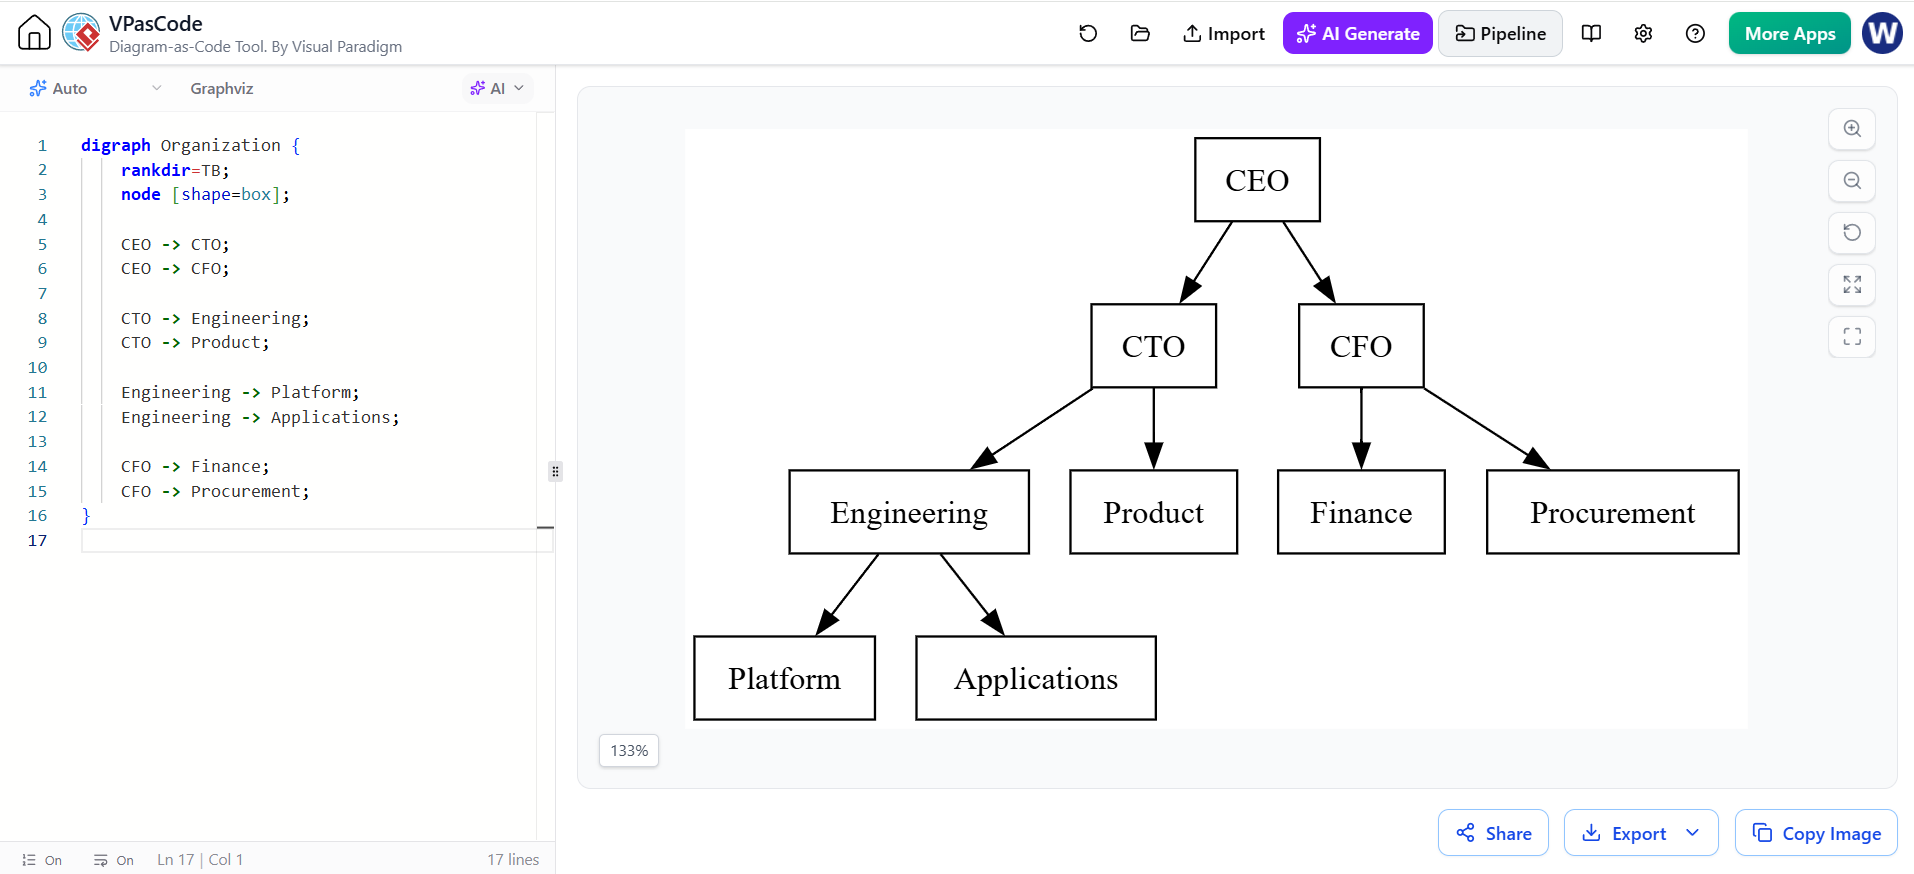
digraph Organization {
    rankdir=TB;
    node [shape=box];

    CEO -> CTO;
    CEO -> CFO;

    CTO -> Engineering;
    CTO -> Product;

    Engineering -> Platform;
    Engineering -> Applications;

    CFO -> Finance;
    CFO -> Procurement;
}
Graphviz best practices
-
Use
rankdir=LRfor dependency flows. -
Use
rankdir=TBfor hierarchies. -
Use clusters to show boundaries.
-
Use different node shapes for services, databases, and external systems.
-
Keep edge labels short.
-
Avoid excessive styling before the structure is correct.
-
Use Graphviz when relationships matter more than formal UML semantics.
10. AI-Assisted Diagram Modification
Generating the initial diagram is only the beginning. The most productive workflow is iterative refinement.
Start with a simple model:

flowchart LR
    User --> WebApp
    WebApp --> API
    API --> Database
Then request focused modifications:
Add a cache between the API and database. Use a cylinder shape for the database and a distinct color for the cache.
Group the API and database inside a backend subgraph.
Add an asynchronous message queue between the API and notification service.
Simplify this diagram for a nontechnical audience. Remove implementation details.
Change the layout from top-to-bottom to left-to-right.
Rename
APItoOrder Management APIand use concise labels elsewhere.
Add failure paths for database and payment errors.
Focused prompts are more reliable than asking AI to redesign the entire diagram repeatedly.
Review AI-generated changes
Before accepting a modification, check:
-
Did the AI preserve existing relationships?
-
Did it introduce components that do not exist?
-
Did it reverse any arrows?
-
Did it confuse synchronous and asynchronous communication?
-
Did it change the meaning of a relationship?
-
Did it use syntax supported by the selected renderer?
-
Did it make the diagram harder to read?
-
Did it expose sensitive implementation details unnecessarily?
If the tool provides a code diff or preview comparison, inspect the textual and visual changes before finalizing them. VPasCode documentation describes AI-assisted modification and review-oriented editing capabilities.
11. Converting Between Mermaid, PlantUML, and Graphviz
Different diagram languages are not perfectly interchangeable. A conversion should preserve the conceptual model, not necessarily every visual detail.
Example conceptual model
Customer → Web Application → Order Service → Payment Provider
                                      ↓
                                Order Database
Mermaid representation
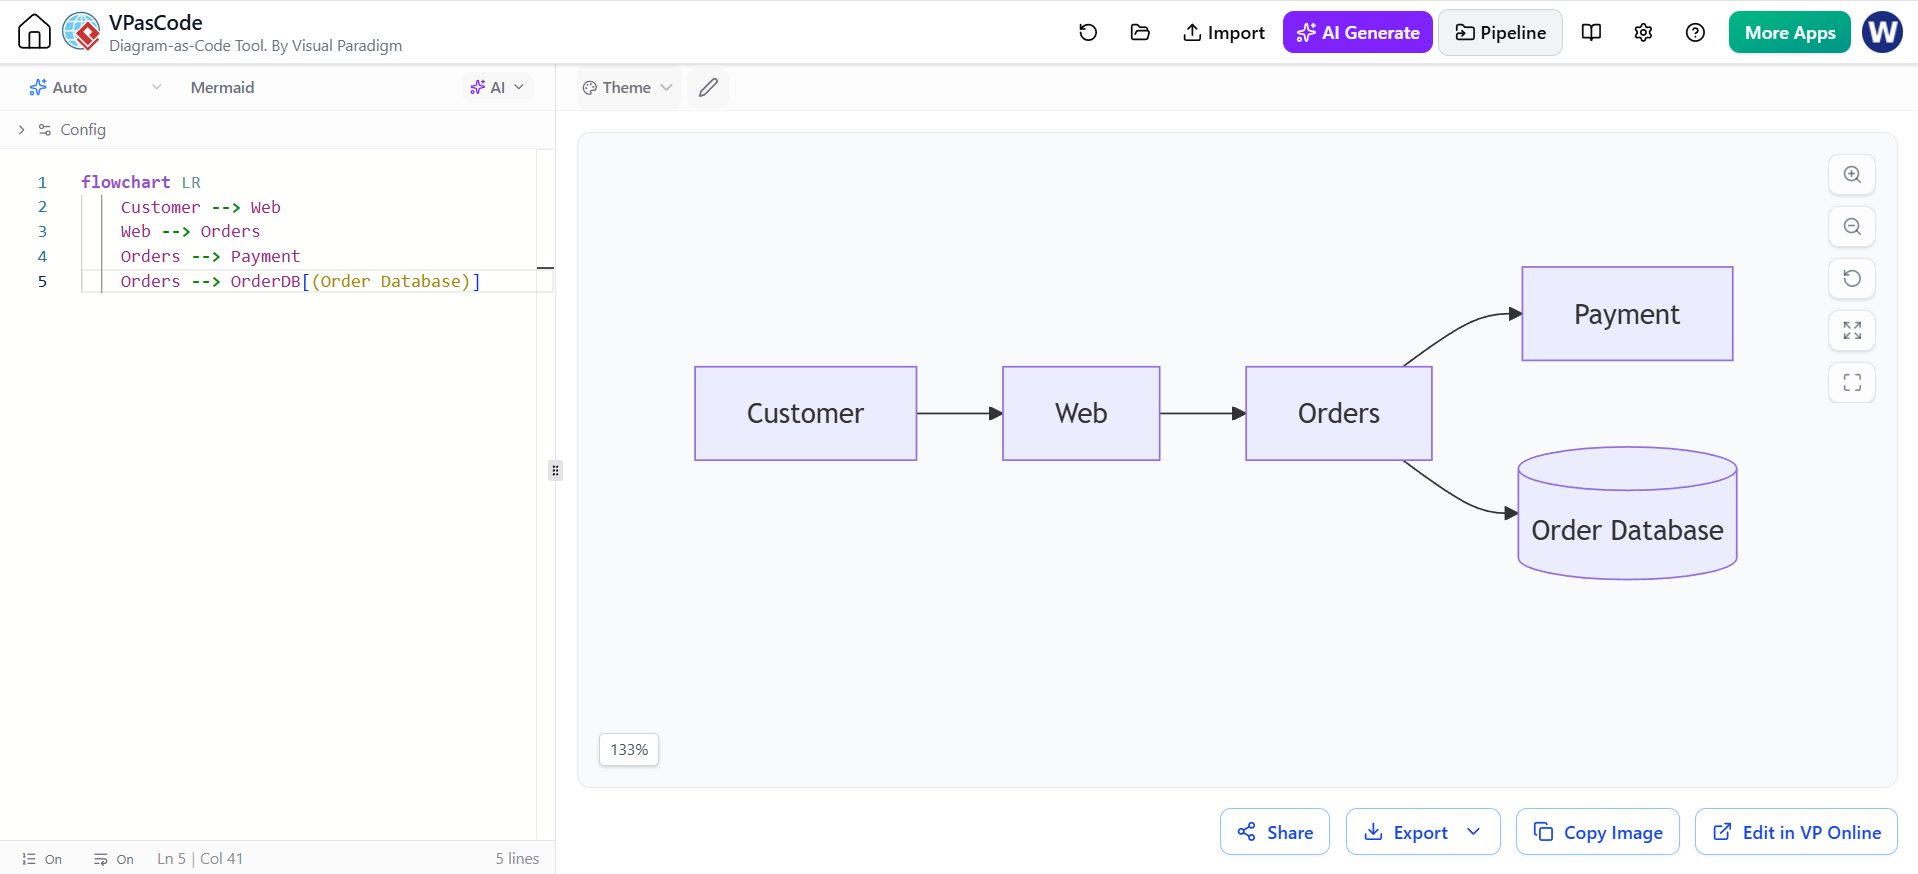
flowchart LR
    Customer --> Web
    Web --> Orders
    Orders --> Payment
    Orders --> OrderDB[(Order Database)]
PlantUML representation
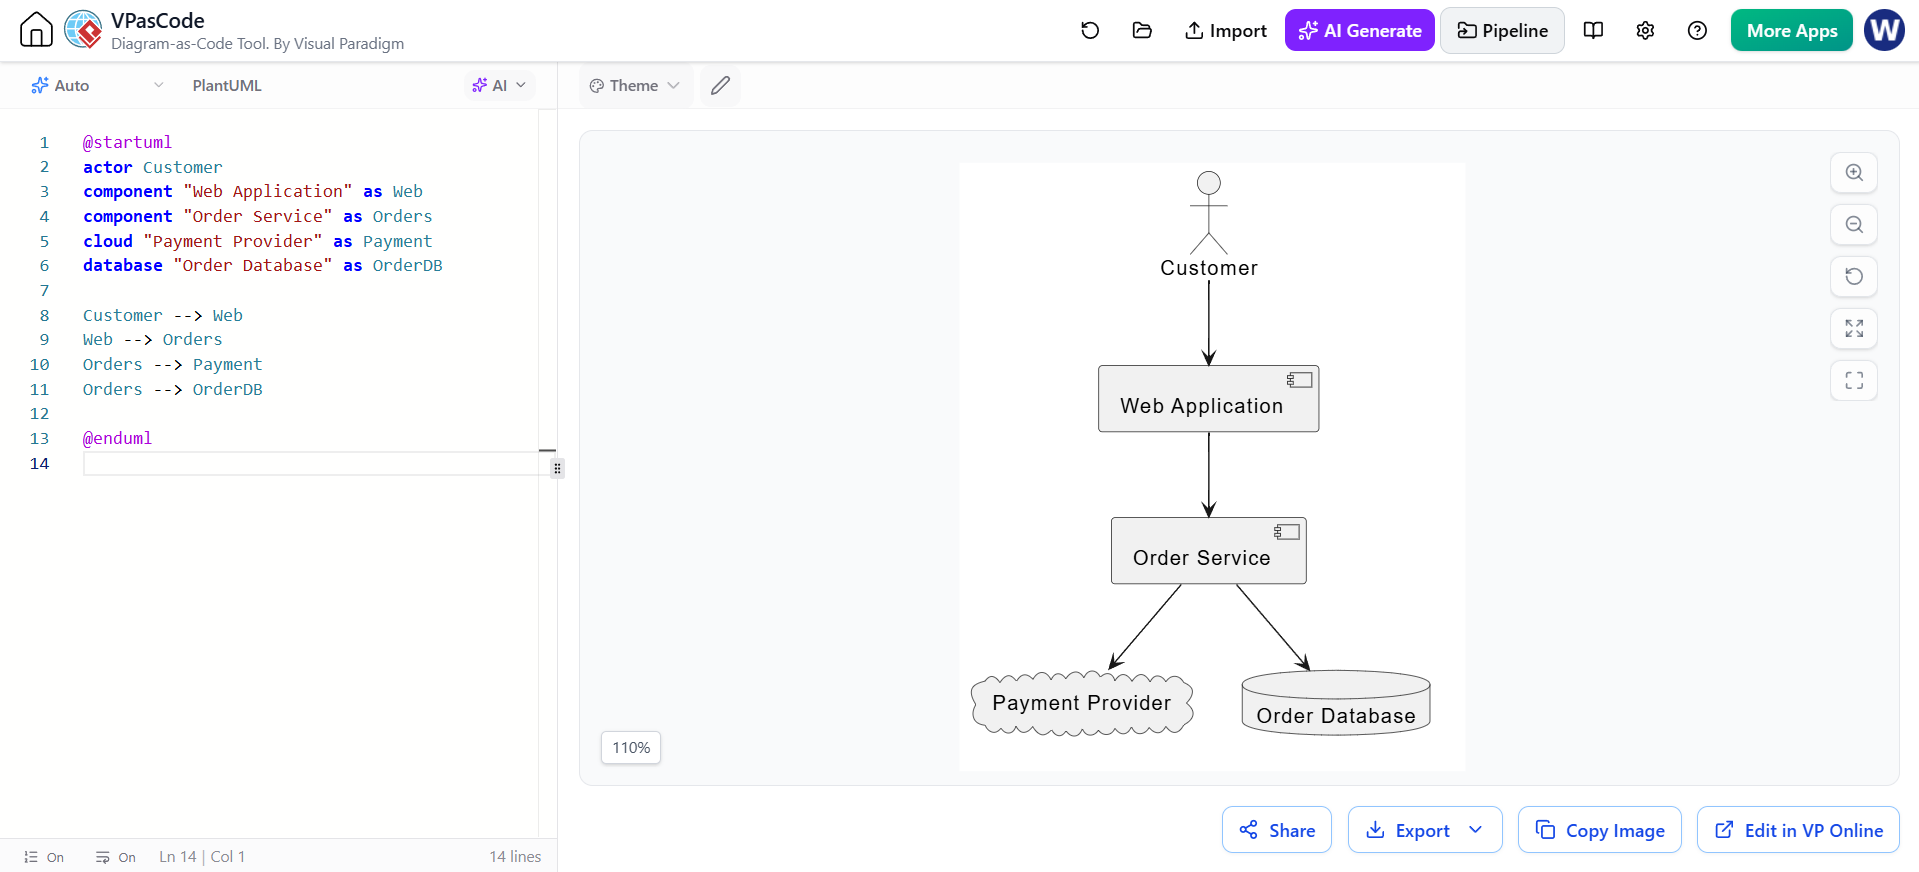
@startuml
actor Customer
component "Web Application" as Web
component "Order Service" as Orders
cloud "Payment Provider" as Payment
database "Order Database" as OrderDB

Customer --> Web
Web --> Orders
Orders --> Payment
Orders --> OrderDB

@enduml
Graphviz representation
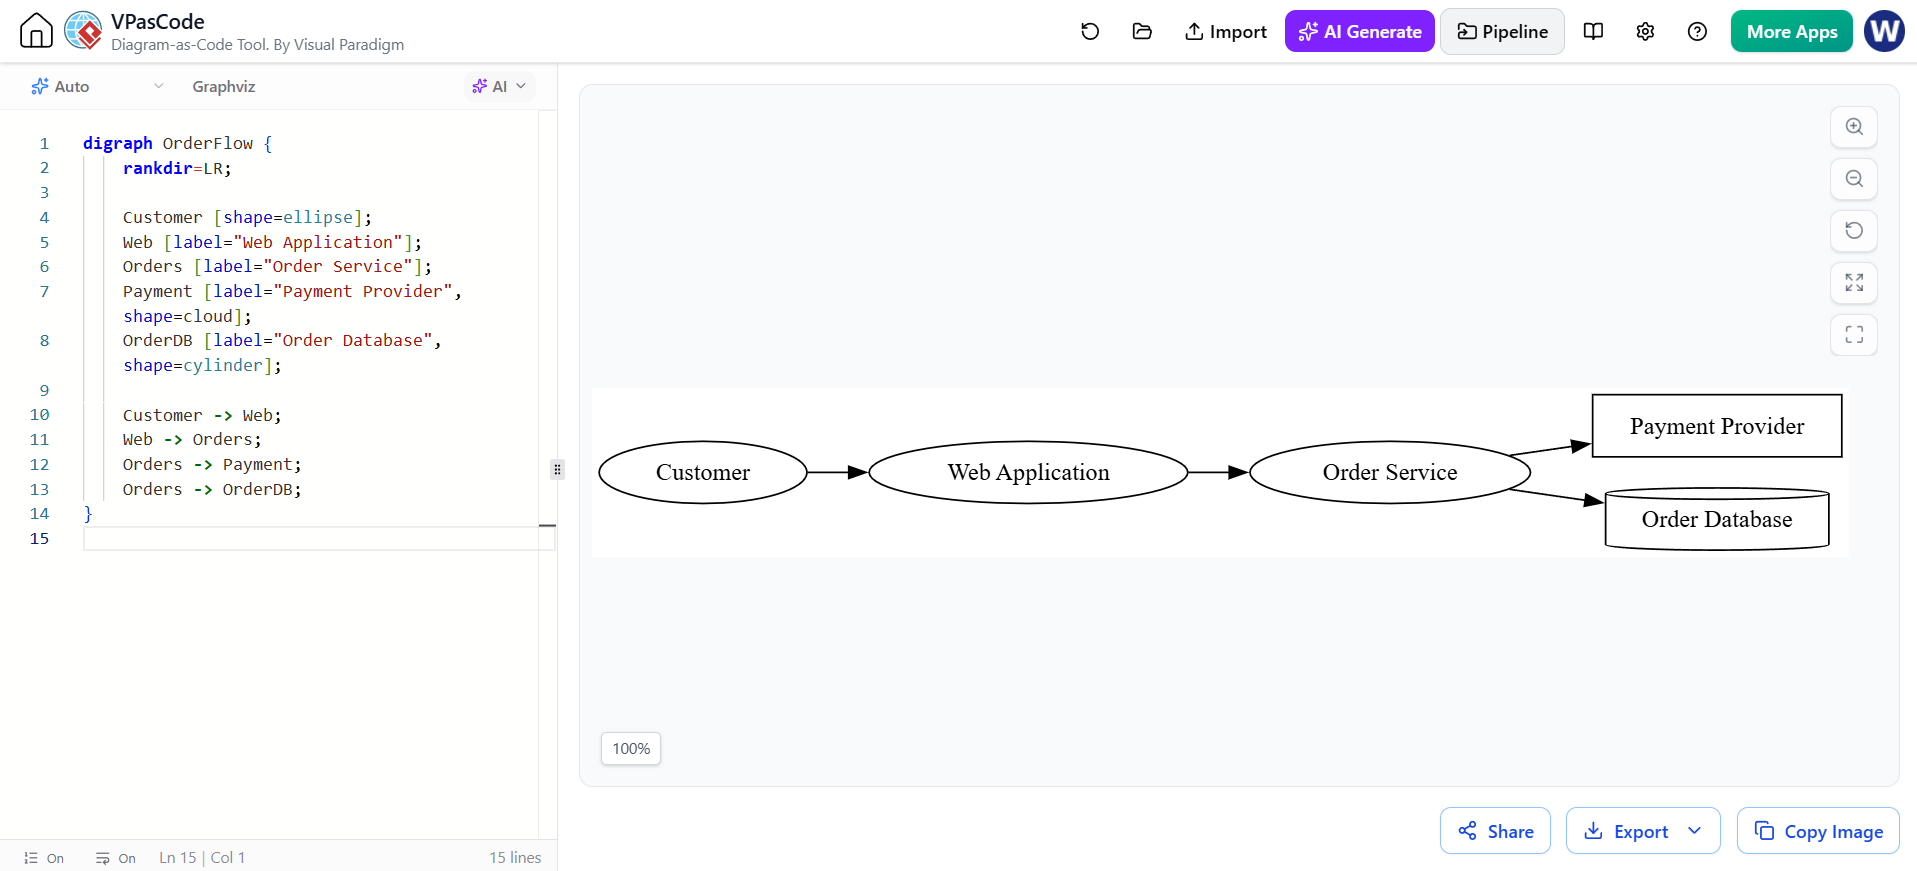
digraph OrderFlow {
    rankdir=LR;

    Customer [shape=ellipse];
    Web [label="Web Application"];
    Orders [label="Order Service"];
    Payment [label="Payment Provider", shape=cloud];
    OrderDB [label="Order Database", shape=cylinder];

    Customer -> Web;
    Web -> Orders;
    Orders -> Payment;
    Orders -> OrderDB;
}
Conversion guidelines
When converting between formats, explicitly tell AI:
-
Which elements must remain unchanged
-
Whether relationships are directional
-
Which boundaries should be preserved
-
Whether the target should be formal UML or a lightweight flowchart
-
Whether styling should be retained or redesigned
-
Whether the output should prioritize documentation compatibility
Example:
Convert this Mermaid flowchart into PlantUML.

Preserve:
- All nodes
- All directional relationships
- The backend boundary
- The distinction between databases and external providers

Use a PlantUML component diagram. Do not add new components.
Return only valid PlantUML code.
12. Designing Diagrams for Different Audiences
The same system may require several diagrams.
Executive audience
Show:
-
Major business systems
-
External partners
-
Customer or user interactions
-
High-level data flows
Avoid:
-
Class names
-
Internal libraries
-
Infrastructure configuration
-
Detailed database tables
Recommended format: PlantUML C4 context or a simple Mermaid flowchart.
Engineering audience
Show:
-
Services
-
APIs
-
Queues
-
Databases
-
Dependencies
-
Failure paths
-
Ownership boundaries
Recommended format: PlantUML component diagrams, Mermaid architecture diagrams, or Graphviz dependency graphs.
Operations audience
Show:
-
Deployment nodes
-
Regions
-
Clusters
-
Load balancers
-
Databases
-
Monitoring and backup systems
Recommended format: PlantUML deployment diagrams or Graphviz topology diagrams.
Product and process audience
Show:
-
User actions
-
Business decisions
-
Approval steps
-
Alternate paths
-
State transitions
Recommended format: Mermaid flowcharts, state diagrams, or PlantUML activity diagrams.
13. Version Control and Repository Organization
Because diagram source is text, it can be stored alongside application code.
A practical structure might be:
docs/
└── diagrams/
    ├── context/
    │   └── system-context.puml
    ├── architecture/
    │   ├── service-architecture.mmd
    │   └── deployment-topology.dot
    ├── workflows/
    │   └── order-processing.mmd
    └── domain/
        └── order-model.puml
Use meaningful filenames that describe the diagram’s purpose rather than its visual appearance.
Good:
order-processing-sequence.puml
service-dependencies.dot
system-context.puml
Less useful:
diagram-final-v2.puml
architecture-new.mmd
test-diagram.dot
Recommended commit practice
Keep diagram changes close to the code or architecture change that caused them.
Example commit:
Add asynchronous notification flow to order architecture diagram
Avoid mixing unrelated visual cleanup with structural changes when possible. Smaller commits make diagram history easier to understand.
14. CI/CD and Documentation Workflows
A mature diagram-as-code workflow can include automated validation and rendering.
A general pipeline might be:
Pull request opened
        ↓
Diagram source checked
        ↓
Syntax rendered
        ↓
Generated output compared
        ↓
Documentation preview built
        ↓
Review approved
        ↓
Diagram published
Useful checks include:
-
Confirm all diagram files render successfully.
-
Detect syntax errors.
-
Generate SVG or PNG outputs.
-
Check for broken references.
-
Compare generated diagrams against previous versions.
-
Publish diagrams to documentation sites.
-
Ensure architecture diagrams are updated with relevant code changes.
Even when VPasCode is used for authoring and review, teams may keep source files in their existing documentation repository and use separate automation for batch rendering.
Pull-request review questions
Reviewers should ask:
-
Does the diagram reflect the current implementation?
-
Is the scope clear?
-
Are external systems distinguished from internal systems?
-
Are arrows labeled clearly?
-
Is the diagram too detailed for its audience?
-
Are any dependencies missing?
-
Does the diagram introduce architectural assumptions?
-
Is the source readable and maintainable?
15. Quality Checklist
Use this checklist before publishing a diagram.
Semantic quality
-
Does the diagram answer one clear question?
-
Are all important entities present?
-
Are relationships accurate?
-
Are direction and sequence correct?
-
Are external systems clearly identified?
-
Are ownership boundaries visible?
Visual quality
-
Is the layout easy to follow?
-
Are labels short and readable?
-
Are related elements grouped?
-
Are crossing lines minimized?
-
Is the diagram understandable without a verbal explanation?
-
Is the amount of detail appropriate for the audience?
Source quality
-
Is the diagram code formatted consistently?
-
Are names meaningful?
-
Are comments used where necessary?
-
Is the selected language appropriate?
-
Can another team member modify the source?
-
Does the code render without errors?
AI quality
-
Did AI invent any components?
-
Did it alter the intended meaning?
-
Did it introduce unsupported syntax?
-
Did it preserve the existing model during modification?
-
Were all AI-generated changes reviewed by a subject-matter expert?
16. Common Problems and Solutions
The diagram is too crowded
Ask AI:
Simplify this diagram for a system-architecture review. Keep only users, major services, databases, external providers, and primary data flows. Remove implementation details and secondary dependencies.
You can also split one diagram into:
-
System context
-
Container architecture
-
Runtime sequence
-
Deployment topology
-
Dependency graph
The AI creates incorrect relationships
Use explicit relationship instructions:
Do not infer relationships. Use only the relationships listed below. If a relationship is not specified, leave it out.
For complex systems, provide a structured list:
Relationships:
- WebApp calls APIGateway using HTTPS.
- APIGateway calls OrderService synchronously.
- OrderService publishes OrderCreated to MessageQueue.
- NotificationService consumes OrderCreated asynchronously.
The syntax does not render
Ask AI to diagnose the exact error:
Fix this PlantUML syntax error. Preserve the diagram structure and return the corrected code only. Explain the correction after the code.
Then verify that the suggested syntax is supported by the selected engine.
The generated diagram looks attractive but is inaccurate
Treat visual quality and semantic quality separately. A polished diagram can still contain false architecture.
Validate every:
-
Component
-
Relationship
-
Direction
-
Boundary
-
Data store
-
External dependency
-
Error path
The diagram changes too much during AI editing
Use narrower modification prompts:
Make only one change: add a message queue between OrderService and NotificationService. Do not modify any other nodes, labels, relationships, or styles.
17. Recommended End-to-End Workflow
Step 1: Define the purpose
Write one sentence:
This diagram explains how an order moves from checkout through payment and fulfillment.
Step 2: Choose the engine
-
Mermaid for a documentation flow
-
PlantUML for a formal architecture or UML model
-
Graphviz for dependencies or network relationships
Step 3: Create a minimal model
Start with the most important actors, components, and relationships.
Step 4: Generate or write the first version
Use an AI prompt with explicit entities and constraints.
Step 5: Render immediately
Use the live preview to identify:
-
Missing elements
-
Ambiguous labels
-
Poor direction
-
Overcrowding
-
Incorrect assumptions
Step 6: Refine in small increments
Ask for one change at a time.
Step 7: Validate against reality
Compare the diagram with:
-
Source code
-
API specifications
-
Infrastructure definitions
-
Database schemas
-
Operational runbooks
-
Team knowledge
Step 8: Export and publish
Use SVG for scalable documentation, PNG for quick sharing, and PDF for printable material. VPasCode advertises export options including PDF, SVG, and PNG.
Step 9: Store the source
Commit the diagram code to version control.
Step 10: Maintain it
Update the diagram whenever the architecture or process changes.
18. Reusable AI Prompt Library
Generate a Mermaid flowchart
Generate a Mermaid flowchart for [process/system].

Use a left-to-right layout.
Include only these elements:
[list]

Use these relationships:
[list]

Group related elements in subgraphs.
Use concise labels.
Do not invent additional components.
Return only valid Mermaid code.
Generate a PlantUML component diagram
Create a PlantUML component diagram for [system].

Internal components:
[list]

External systems:
[list]

Databases:
[list]

Relationships:
[list]

Show system boundaries and label each relationship.
Keep the diagram suitable for an architecture review.
Return only valid PlantUML code.
Generate a Graphviz dependency graph
Create a Graphviz DOT directed dependency graph.

Nodes:
[list]

Edges:
[list]

Use left-to-right layout.
Use boxes for services, cylinders for databases, and clouds for external providers.
Group nodes by subsystem where appropriate.
Do not infer missing dependencies.
Return only valid DOT code.
Simplify a diagram
Simplify this diagram for [audience].

Preserve:
- [important elements]
- [important relationships]

Remove:
- [implementation details]
- [secondary dependencies]

Do not change the meaning of any remaining relationship.
Review for accuracy
Review this diagram against the following architecture description:

[architecture description]

Identify:
1. Missing components
2. Incorrect relationships
3. Incorrect direction
4. Unclear labels
5. Unsupported assumptions

Do not rewrite the diagram yet.
Refactor for readability
Improve the readability of this diagram without changing its meaning.

You may:
- Group related nodes
- Reorient the layout
- Shorten labels
- Add boundaries
- Use consistent styles

You must not:
- Add new components
- Remove existing relationships
- Change relationship direction
- Rename domain concepts without preserving their meaning
19. Final Recommendations
The most effective VPasCode workflow is not “ask AI to draw everything.” It is:
-
Define the communication goal.
-
Select the language that fits the diagram.
-
Generate a small first version.
-
Render it immediately.
-
Refine with narrowly scoped AI instructions.
-
Review the model for technical accuracy.
-
Store the source in version control.
-
Regenerate and publish the diagram as part of documentation.
Use Mermaid for accessible documentation diagrams, PlantUML for formal UML and architecture modeling, and Graphviz for dependency and network analysis. VPasCode brings these approaches together in one editor, while AI reduces the syntax and iteration burden. The final responsibility, however, remains with the author and architecture reviewers: AI can accelerate diagram creation, but it should not be treated as the authoritative source of system truth.