Applying State Diagrams: A Comprehensive Guide
Introduction
State diagrams are powerful tools used in various fields to model and visualize the behavior of systems, processes, and entities. They are especially useful for understanding and designing complex systems, providing a clear visual representation of how different states and transitions between them affect the overall functionality. In this article, we will explore how to apply state diagrams effectively in different usage cases, from software development to business process management and beyond.
-
Software Development
State diagrams play a crucial role in software development, aiding in the design and implementation of complex software systems. They help developers and designers to:
- a. Model Software Behavior: State diagrams are particularly useful for modeling the behavior of software applications. Each state represents a specific condition or mode that the software can be in, and transitions illustrate how the software moves from one state to another based on various inputs or events.
- b. Identify Edge Cases: State diagrams can help identify edge cases and exceptional scenarios that may not be apparent when working solely with code. By visualizing all possible states and transitions, developers can anticipate and address potential issues.
- c. Improve Collaboration: State diagrams serve as a common visual language for developers, testers, and stakeholders. They facilitate communication and collaboration among team members, ensuring everyone has a shared understanding of the software’s behavior.
- d. Debugging: Debugging becomes more efficient with state diagrams as they provide a clear roadmap for tracing and diagnosing issues within the software. Developers can track the path of execution through different states and pinpoint where problems occur.
Example: Online Shopping Cart
In the context of an online shopping cart application, you can use a state diagram to model the various states and transitions of the shopping cart. The states could include “Empty Cart,” “Cart with Items,” “Checkout,” and “Order Confirmation.” Transitions would represent actions like “Add Item,” “Remove Item,” and “Proceed to Checkout.” This state diagram would help developers understand how the shopping cart behaves and how it transitions between states as users interact with it.
-
Business Process Management
State diagrams are equally valuable in the realm of business process management. They enable organizations to:
- a. Analyze Workflows: State diagrams help in visualizing and analyzing complex business workflows. Each state represents a specific step or phase in a process, while transitions depict how information or resources flow from one state to another.
- b. Optimize Processes: By modeling existing processes using state diagrams, organizations can identify bottlenecks, redundant steps, and opportunities for optimization. This aids in streamlining operations and improving efficiency.
- c. Implement Automation: State diagrams serve as a blueprint for automating business processes. They help in designing workflow automation systems that can handle repetitive tasks, reducing human intervention and the risk of errors.
- d. Compliance and Auditing: State diagrams assist in ensuring compliance with industry regulations and standards. They provide a clear audit trail by documenting how processes operate, making it easier to demonstrate adherence to compliance requirements.
Business Process Management:
Example: Order Processing Workflow
Imagine a business that handles customer orders. A state diagram could represent the order processing workflow. States might include “Order Received,” “Payment Pending,” “Order Processing,” “Shipment Ready,” and “Order Completed.” Transitions would show how an order progresses through these states, triggered by events like “Payment Received” and “Shipment Dispatched.” This state diagram aids in visualizing and optimizing the order fulfillment process.
-
Hardware Systems
State diagrams are also applied in the field of hardware systems, such as electronics and robotics, to:
- a. Design Control Systems: Engineers use state diagrams to design control systems for hardware devices. States represent different operating modes, and transitions define how the system responds to various inputs or sensor readings.
- b. Test and Validation: State diagrams are used to create test scenarios and validate the functionality of hardware systems. They provide a systematic way to verify that the system behaves as intended under different conditions.
- c. Troubleshooting: When hardware systems malfunction, state diagrams can be invaluable for troubleshooting. They help engineers understand the system’s current state and trace the path that led to the issue.
- d. Predictive Maintenance: In industrial settings, state diagrams are used to implement predictive maintenance strategies. By monitoring the state of machines and equipment, maintenance teams can schedule repairs or replacements before failures occur.
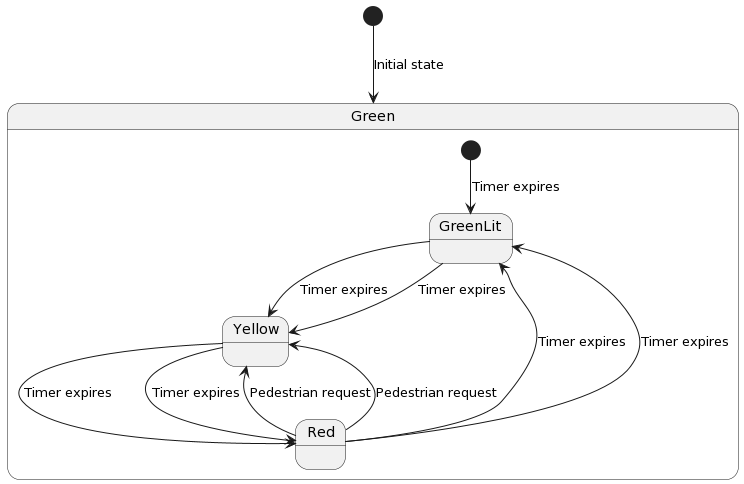
Example: Traffic Light Control System
Consider a traffic light control system at an intersection. A state diagram can represent the different states of the traffic lights, such as “Green,” “Yellow,” and “Red.” Transitions would indicate how the lights change based on time intervals or sensor inputs. For instance, when the “Green” light’s timer expires, it transitions to “Yellow,” and then to “Red.” This state diagram helps engineers design and maintain the traffic light system.

These examples illustrate how state diagrams are applied in diverse contexts. They provide a clear visual representation of states and transitions, making it easier to understand, design, and manage complex systems, processes, and hardware.
A more Complex Example of State Chart
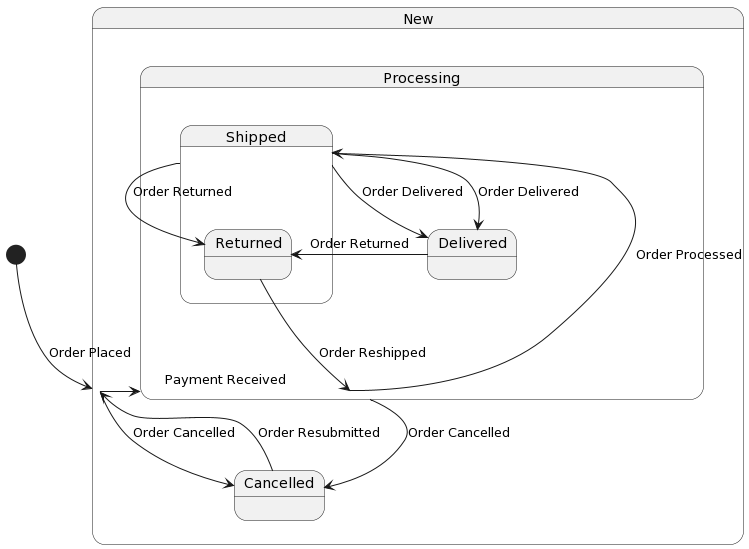
In this scenario, we have an online order processing system that manages orders from the moment they are placed until they are delivered. The system has several order statuses and various events that trigger state transitions.

Explanation:
- The diagram starts with an initial state of “New” when an order is placed.
- Transitions between states represent different events and conditions.
- Orders move from “New” to “Processing” when payment is received.
- Orders can be canceled at any stage, moving to the “Cancelled” state.
- Orders in the “Processing” state can transition to “Shipped” when processing is complete.
- Orders in the “Shipped” state can be delivered or returned.
- The “Delivered” state represents successful order delivery.
- Orders can be returned, leading to possible reshipping and processing.
- Canceled orders can be resubmitted, returning to the “New” state.
This complex state diagram models the lifecycle of online orders through various statuses and transitions, helping to illustrate the order processing system’s behavior.
Conclusion
State diagrams are versatile tools with applications across various domains, from software development to business process management and hardware systems. They offer a structured and visual representation of how entities or systems transition between different states, making them invaluable for modeling, analysis, optimization, and troubleshooting. Whether you are a software developer, business analyst, or engineer, mastering the art of using state diagrams can greatly enhance your ability to design, manage, and improve complex systems and processes.

