


Managing modern cloud infrastructure, hybrid data centers, and multi-tier subnets requires precise visual documentation. However, manually drawing network diagrams in visual canvas applications creates significant maintenance overhead. As server instances scale and routing policies change, static image assets quickly become out of date. Using a modern diagram-as-code platform allows DevOps teams and site reliability engineers (SREs) to generate network maps directly from infrastructure definitions. By editing scripts inside a browser-based Graphviz editor, teams can produce clean, version-controlled network topologies in seconds.
In this guide, we will explore how to build network topology maps using Graphviz DOT language, why algorithmic layout engines outperform manual drawing tools, and how a unified diagram-as-code platform optimizes infrastructure documentation.
Why Map Network Topologies with Graphviz DOT?
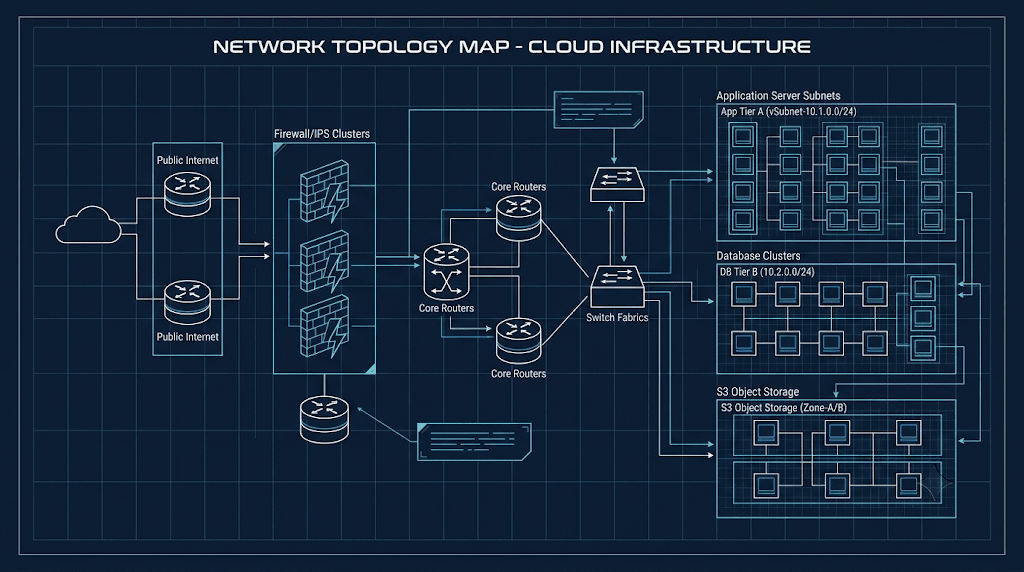
Traditional drag-and-drop design utilities force engineers to spend hours manually positioning server icons, adjusting connector lines, and aligning subnet boundaries. When infrastructure expands or failover routes trigger, rearranging canvas objects wastes valuable technical bandwidth. A text-to-diagram workflow solves this by utilizing automated layout algorithms to handle node placement.
Using a dedicated browser-based Graphviz editor for infrastructure mapping delivers key benefits:
- Automated Subnet Clustering: Group servers, load balancers, and database clusters into logical subgraphs with automatic boundary layout.
- Git-Integrated Infrastructure Docs: Store DOT network definitions directly alongside Terraform, Ansible, or Kubernetes configuration files.
- Algorithmic Node Routing: The underlying
dotengine automatically calculates non-overlapping connection paths for complex routing networks.
Adopting an advanced diagram-as-code platform ensures that your network architecture documentation stays perfectly synchronized with actual cloud deployments.
Building a Network Topology Diagram Step-by-Step
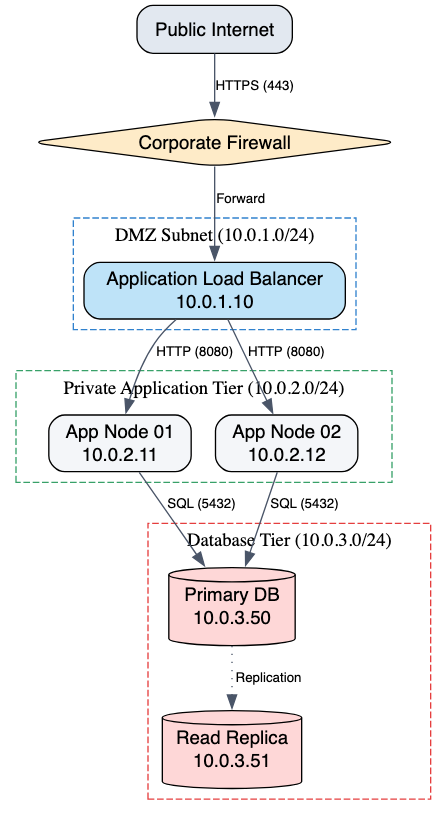
Let’s examine how to construct a multi-tier enterprise network topology—featuring an internet gateway, public load balancers, private application clusters, and isolated database instances—using DOT syntax. Here is a practical code example you can copy and paste directly into your browser-based Graphviz editor:
Network Topology Code Example (Try it Now):
digraph NetworkTopology {
    rankdir=TB;
    compound=true;
    node [shape=box, style="filled,rounded", fillcolor="#f4f6f9", fontname="Helvetica"];
    edge [color="#4a5568", fontname="Helvetica", fontsize=10];

    // Perimeter Infrastructure
    Internet [shape=cloud, fillcolor="#e2e8f0", label="Public Internet"];
    FW [shape=diamond, fillcolor="#feebc8", label="Corporate Firewall"];

    // Public DMZ Subnet
    subgraph cluster_dmz {
        label="DMZ Subnet (10.0.1.0/24)";
        style=dashed;
        color="#3182ce";
        LB [label="Application Load Balancer\n10.0.1.10", fillcolor="#bee3f8"];
    }

    // Private App Subnet
    subgraph cluster_app {
        label="Private Application Tier (10.0.2.0/24)";
        style=dashed;
        color="#38a169";
        App1 [label="App Node 01\n10.0.2.11"];
        App2 [label="App Node 02\n10.0.2.12"];
    }

    // Isolated Data Subnet
    subgraph cluster_db {
        label="Database Tier (10.0.3.0/24)";
        style=dashed;
        color="#e53e3e";
        PrimaryDB [shape=cylinder, label="Primary DB\n10.0.3.50", fillcolor="#fed7d7"];
        ReplicaDB [shape=cylinder, label="Read Replica\n10.0.3.51", fillcolor="#fed7d7"];
    }

    // Network Connections
    Internet -> FW [label="HTTPS (443)"];
    FW -> LB [label="Forward"];
    LB -> App1 [label="HTTP (8080)"];
    LB -> App2 [label="HTTP (8080)"];
    App1 -> PrimaryDB [label="SQL (5432)"];
    App2 -> PrimaryDB [label="SQL (5432)"];
    PrimaryDB -> ReplicaDB [label="Replication", style=dotted];
}
Eliminating Syntax Friction with AI in VPasCode
When modeling enterprise networks with hundreds of nodes, intricate firewall rules, and cross-subnet links, minor syntax mistakes—such as missing semicolons, malformed cluster braces, or unescaped quotes—can halt execution. Utilizing VPasCode as your primary diagram-as-code platform gives your engineering team access to 1-Click AI Code Error Fixing to resolve syntax glitches instantly.
Whether you are drafting software architecture models, mapping state transitions, or generating network maps, an intelligent browser-based Graphviz editor catches formatting errors automatically so you can maintain technical momentum.
Best Practices for Infrastructure Documentation
To ensure high clarity and maintainability when sharing network maps across DevOps, security, and operations teams, follow these core guidelines:
- Use Subgraph Clusters for Security Tiers: Group server instances within
subgraph cluster_*blocks to clearly demarcate VPC boundaries, DMZs, and private subnets. - Leverage Distinct Node Shapes: Assign intuitive shapes—such as clouds for internet gateways, diamonds for firewalls, and cylinders for databases—to enhance visual parsing.
- Export High-Resolution Vector Assets: Export crisp SVG or PNG visual assets directly from your browser-based Graphviz editor to embed in internal runbooks or publish online via Visual Paradigm OpenDocs integration.
Relying on a powerful browser-based Graphviz editor backed by a complete diagram-as-code platform empowers system administrators and SREs to build production-ready network documentation with ease.
Transform Your Infrastructure Mapping Today
Ready to standardize your network documentation and generate automated topology maps from text in seconds? Try VPasCode’s feature-rich browser-based Graphviz editor today and experience instant 1-Click code error fixing, multi-format rendering, and seamless diagram-as-code capabilities.