AI Diagram Generation
That Actually Covers Every Angle
Only at
Visual Paradigm
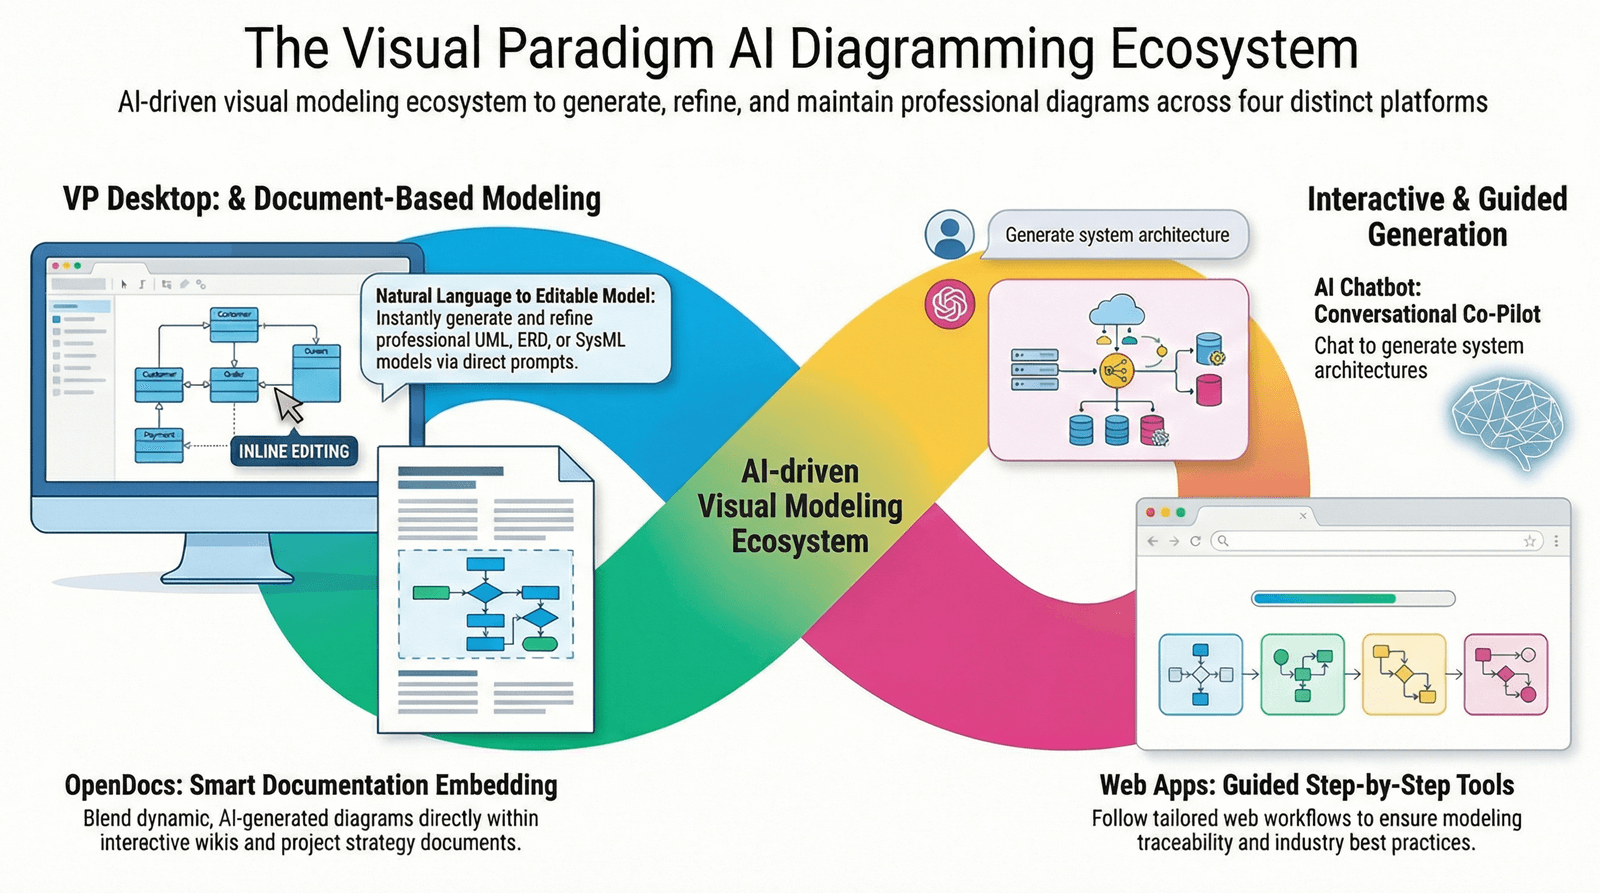
Our Four AI-Powered Platforms
1.
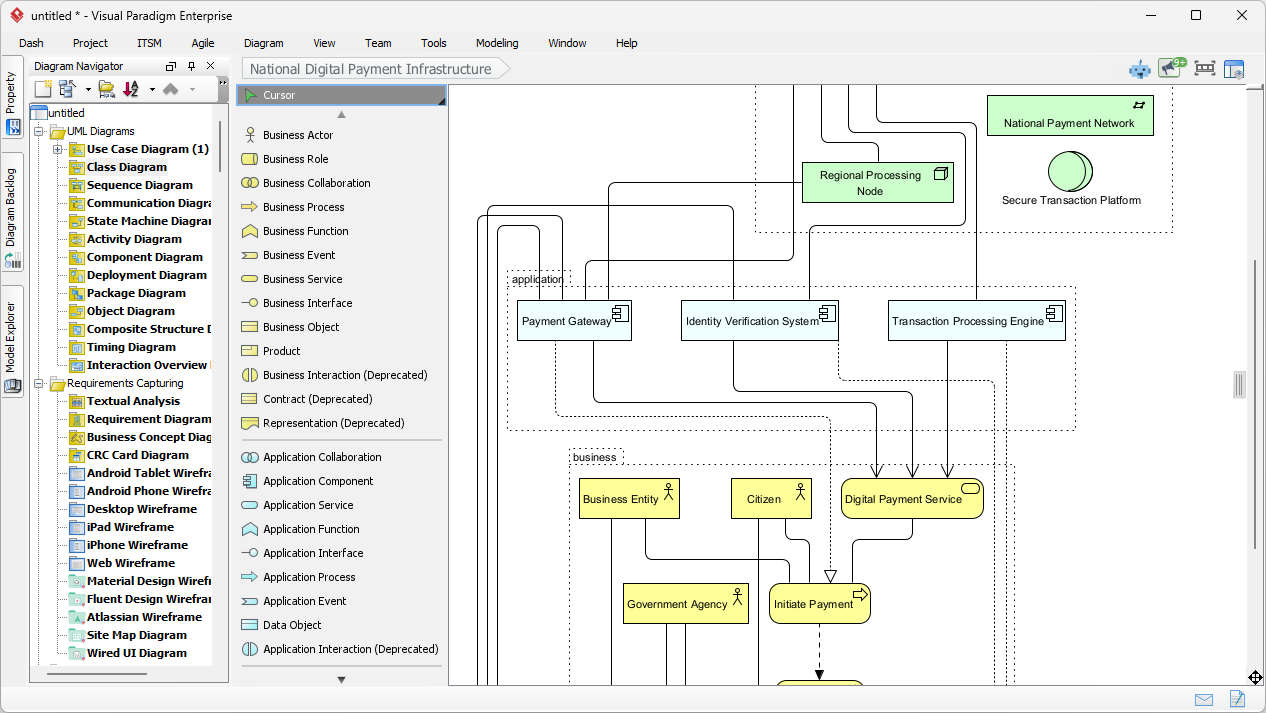
VP Desktop (Visual Model)
Our flagship desktop application integrates AI directly into a robust, professional diagramming environment for deep, offline modeling. Use this when you need full control over complex projects requiring precision, such as enterprise-level UML or SysML designs, code engineering, or team collaboration with version control. The unique value lies in its seamless blend of AI generation with advanced editing tools—saving hours on initial setups while ensuring models are production-ready, traceable, and exportable to code or reports. This isn’t a quick sketch tool; it’s for serious developers and architects who demand accuracy and scalability in their workflows. Visual Paradigm home page.
2.
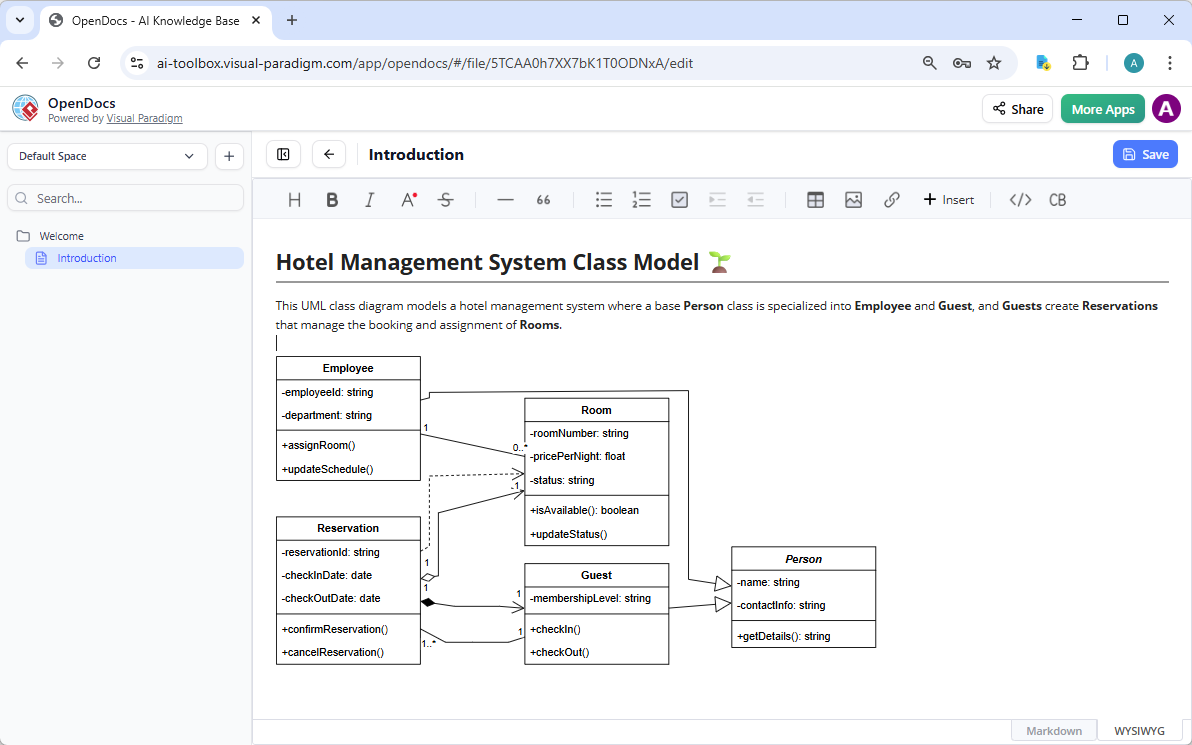
OpenDocs
As our innovative knowledge management platform, OpenDocs combines document creation with live, AI-assisted diagramming—similar to Notion or GitBook but with embedded visuals that stay dynamic and editable. Turn to this when building collaborative knowledge bases, wikis, or reports where diagrams must integrate seamlessly into text, like illustrating processes in team docs or embedding mind maps in strategy guides. Its distinct benefit is fostering team alignment through interactive content; diagrams aren’t static images but living elements you can refine inline, making it essential for organizations prioritizing knowledge sharing and real-time updates without switching tools.
3.
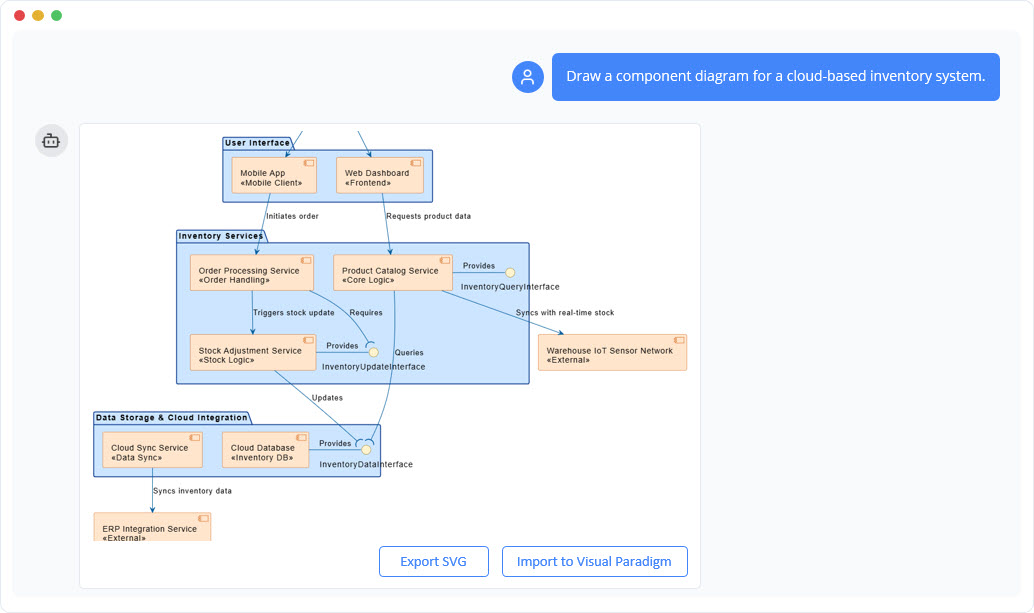
AI Visual Modeling Chatbot
Our conversational AI Assistant transforms diagramming into an interactive dialogue, generating and refining models through natural language chats—available standalone or integrated with desktop tools. Opt for this when brainstorming ideas, prototyping quickly, or iterating on designs in an agile setting, such as describing a system flow to instantly create a sequence diagram and then tweaking it via follow-up questions. The key value is its flexibility and speed for exploratory work; it handles explanations, analyses, and exports, acting as a true co-pilot that bridges novice users to expert results—ideal for fast-paced teams where overcoming “blank canvas” blocks is critical, without compromising on professional outputs.
4.
Web Apps Step-by-Step / Guided Tools
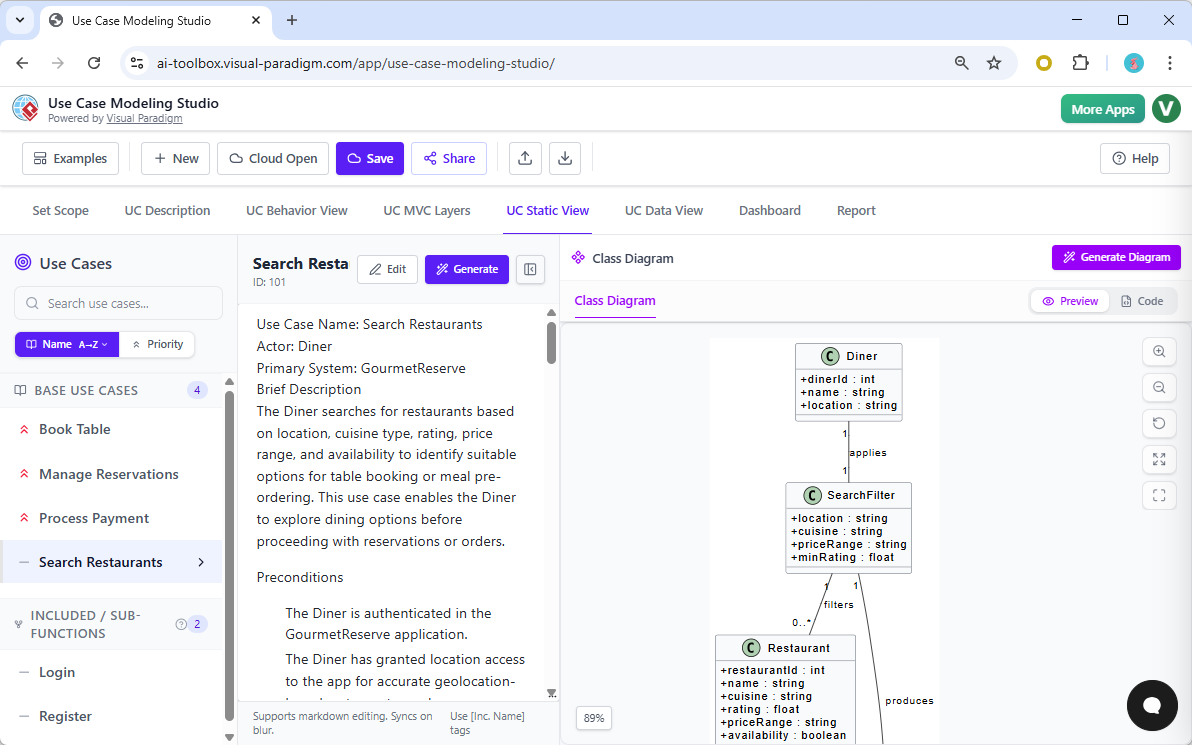
These browser-based, specialized applications offer structured workflows with AI guidance for specific diagram paradigms, ensuring best practices and inter-model traceability. Choose this for methodical projects like software architecture (e.g., C4 PlantUML Studio) or requirements analysis (e.g., Use Case Modeling Studio), where you need to build interconnected diagrams step-by-step without errors. The unique advantage is its enforcement of systematic approaches—preventing isolated models and promoting consistency, with built-in reports and exports. Far from gimmicks, these are powerhouse tools for enterprises tackling complex systems, delivering reliable, scalable results that integrate with your broader ecosystem.
Why Visual Paradigm Leads in AI Visual Modeling
What sets Visual Paradigm apart is our commitment to comprehensive AI integration-no other provider matches our breadth of support across these platforms. We focus on real-world usability, from instant AI diagram generation to collaborative editing, all while prioritizing accuracy and user control. This ecosystem not only accelerates your workflow but also ensures your models are professional, interconnected, and ready for implementation.
- Widest diagram coverage with true AI integration
- Multiple workflows: chat, desktop, docs, guided studios
- Real traceability and refinement – not just one-shot generation
See the full comparison matrix below to discover exactly which diagrams are supported on each platform.
AI Diagram Generation Full Feature Comparison Matrix
The comparison matrix below shows all supported diagram types as rows and the four main Visual Paradigm platforms as columns. Each cell indicates whether a specific diagram type is available and fully supported on that platform: a checkmark (✓) means the diagram can be created, generated, edited, or embedded using AI assistance on the corresponding platform. This overview helps you quickly see our comprehensive coverage across Desktop (Visual Model), OpenDocs, Visual Modeling Chatbot, and Web App.
UML Diagrams Support Matrix
Visual Paradigm delivers the most complete AI UML diagram generator ecosystem, covering all core UML 2.x diagram types with strong AI assistance on multiple platforms. This matrix shows exact support levels for AI-powered UML class diagram, sequence diagram, use case diagram, activity diagram, state machine diagram, component diagram, deployment diagram, communication diagram, object diagram, timing diagram, and package diagram across Desktop (Visual Model AI Generator), OpenDocs, AI Visual Modeling Chatbot, and guided Web Apps.
| Feature | VP Desktop Visual Modeling | OpenDocs Casual Diagramming | Chatbot Visual Model Co-Pilot | Web Apps Step-by-Step, Guided | Articles |
|---|---|---|---|---|---|
| Use case diagram | 🖥📖🤖🌐 | ✓ | ✓ | Diagram generation:
Analysis and reporting: | 📎 |
| Class diagram | 🖥📖🤖🌐 | ✓ | ✓ | 📎 | |
| Sequence diagram | 🖥📖🤖🌐 | ✓ | ✓ | 📎 | |
| Communication diagram | 🖥 | – | – | – | 📎 |
| Activity diagram | 🖥📖🤖🌐 | ✓ | ✓ | 📎 | |
| State machine diagram | 🖥📖🤖 | ✓ | ✓ | – | 📎 |
| Deployment diagram | 🖥📖🤖 | ✓ | ✓ | – | 📎 |
| Component diagram | 🖥📖🤖 | ✓ | ✓ | – | 📎 |
| Object diagram | 🖥📖🤖 | ✓ | ✓ | – | 📎 |
| Timing diagram | 🖥 | – | – | – | 📎 |
| Package diagram | 🖥📖🤖 | ✓ | ✓ | – | 📎 |
| Composite structure diagram | 🖥📖🤖 | ✓ | ✓ | – | 📎 |
| Profile diagram | 🖥📖 | ✓ | 📎 |
SysML Diagrams Support Matrix
Systems engineers benefit from Visual Paradigm’s dedicated AI SysML diagram support, enabling rapid creation and refinement of key SysML constructs. View the matrix for coverage of Requirement Diagram, Block Definition Diagram, Internal Block Diagram, and Parametric Diagram across our four AI-enabled platforms: Desktop Visual Model, OpenDocs embeds, conversational Chatbot Co-Pilot, and specialized web apps.
C4 Model & Architecture Diagrams Support Matrix
Visual Paradigm stands out with its AI-powered C4 modeling tools – especially through the guided C4 PlantUML Studio that maintains traceability across abstraction levels. This support matrix lists availability for C4 Context Diagram, C4 Containers Diagram, C4 Components Diagram, C4 System Landscape Diagram, C4 Dynamic Diagram, and C4 Deployment Diagram on Desktop, Chatbot Co-Pilot, and Web Apps.
| Feature | VP Desktop Visual Modeling | OpenDocs Casual Diagramming | Chatbot Visual Model Co-Pilot | Web Apps Step-by-Step, Guided | Articles |
|---|---|---|---|---|---|
| C4 System context diagram | 🖥🤖🌐 | – | ✓ | AI-Powered C4 PlantUML Studio | 📎 |
| C4 Container diagram | 🖥🤖🌐 | – | ✓ | AI-Powered C4 PlantUML Studio | 📎 |
| C4 Component diagram | 🖥🤖🌐 | – | ✓ | AI-Powered C4 PlantUML Studio | 📎 |
| C4 System landscape diagram | 🖥🌐 | – | – | AI-Powered C4 PlantUML Studio | 📎 |
| C4 Dynamic diagram | 🖥🌐 | – | – | AI-Powered C4 PlantUML Studio | 📎 |
| C4 Deployment diagram | 🖥🤖🌐 | – | ✓ | AI-Powered C4 PlantUML Studio | 📎 |
Other IT Diagrams Support Matrix
This table details Visual Paradigm’s support for essential software development and data modeling diagrams frequently used in IT projects. Check platform availability for Entity Relationship Diagram (ERD), Chen Notation ERD, Data Flow Diagram (DFD), Yourdon & Coad DFD, Yourdon DeMarco DFD, Gane and Sarson DFD, CRC Card Diagram, and Textual Analysis – with AI generation in Desktop and web apps for many of these types.
| Feature | VP Desktop Visual Modeling | OpenDocs Casual Diagramming | Chatbot Visual Model Co-Pilot | Web Apps Step-by-Step, Guided | Articles |
|---|---|---|---|---|---|
| Entity relationship diagram | 🖥📖🌐 | ✓ | – | 📎 | |
| Chen notation ERD | 🖥 | – | – | – | 📎 |
| Data flow diagram | 🖥📖 | ✓ | ✓ | – | 📎 |
| Textual analysis | 🖥🌐 | – | – | AI-Powered Textual Analysis | 📎 |
| Yourdon & Coad DFD | 🖥📖 | ✓ | – | – | 📎 |
| Gane and Sarson DFD | 🖥📖 | ✓ | – | – | 📎 |
| Yourdon DeMarco | 🖥📖 | ✓ | – | – | 📎 |
| CRC card diagram | 🖥 | – | – | – | 📎 |
Enterprise Architecture
or Business Improvement Support Matrix
For enterprise architects and process improvement teams, Visual Paradigm provides robust support for ArchiMate and related business diagrams. The table below shows platform-level availability for ArchiMate Diagram (including about 26 viewpoints), Conversation Diagram, Decision Table, and Process Overview Diagram – with particularly strong AI generation and viewpoint assistance in Desktop and Chatbot.
| Feature | VP Desktop Visual Modeling | OpenDocs Casual Diagramming | Chatbot Visual Model Co-Pilot | Web Apps Step-by-Step, Guided | Articles |
|---|---|---|---|---|---|
| ArchiMate diagram | 🖥📖🤖 | ✓ | ✓ | – | 📎 |
| ArchiMate viewpoints | 🖥🤖 | – | ✓ | – | 📎 |
| Conversation diagram | 🖥 | – | – | – | 📎 |
| Decision table | 🖥🌐 | – | – | AI-Powered Decision Table Generator | 📎 |
| Process overview diagram | 🖥 | – | – | – | 📎 |
| EPC diagram | 🖥📖 | ✓ | – | – | 📎 |
| Value Stream Mapping | 🌐 | – | – | Value Stream Mapping Editor | 📎 |
| Stakeholder Interaction | 🌐 | – | – | Intelligent BPM and Analysis Suite | 📎 |
Cloud Architecture Diagrams Support Matrix
In an era where cloud infrastructure is the backbone of every modern business, designing efficient, scalable, and resilient architectures has never been more critical yet challenging. Our AI Cloud Architecture Studio is engineered to transform how you approach cloud design, making it intuitive, fast, and incredibly powerful. The table below shows platform-level availability for Cloud Architecture Diagrams.
| Feature | VP Desktop Visual Modeling | OpenDocs Casual Diagramming | Chatbot Visual Model Co-Pilot | Web Apps Step-by-Step, Guided | Articles |
|---|---|---|---|---|---|
| AWS architecture diagram | 🌐 | ✓ | – | AI Cloud Architecture Studio | 📎 |
| Azure architecture diagram | 🌐 | – | – | AI Cloud Architecture Studio | 📎 |
| Google Cloud diagram | 🌐 | – | – | AI Cloud Architecture Studio | 📎 |
| Alibaba cloud architecture diagram | 🌐 | – | – | AI Cloud Architecture Studio | 📎 |
| Oracle cloud architecture diagram | 🌐 | – | – | AI Cloud Architecture Studio | 📎 |
| IBM cloud architecture diagram | 🌐 | ✓ | – | AI Cloud Architecture Studio | 📎 |
| Kubernetes architecture diagram | 🌐 | – | – | AI Cloud Architecture Studio | 📎 |
| DigitalOcean architecture diagram | 🌐 | – | – | AI Cloud Architecture Studio | 📎 |
| OpenStack architecture diagram | 🌐 | – | – | AI Cloud Architecture Studio | 📎 |
| Elastic architecture diagram | 🌐 | – | – | AI Cloud Architecture Studio | 📎 |
Strategic Analysis Support Matrix
Business analysts and strategists use Visual Paradigm’s AI strategic analysis tools to quickly generate insights into internal capabilities, external environments, and competitive positioning. This matrix details support for SWOT Analysis AI tool, PEST Analysis, PESTLE Analysis, SOAR Analysis, TOWS Analysis, 5C’s Analysis, Porter’s Five Forces, McKinsey 7S Model, VRIO Framework, and Johari Window across all four platforms.
| Feature | VP Desktop Visual Modeling | OpenDocs Casual Diagramming | Chatbot Visual Model Co-Pilot | Web Apps Step-by-Step, Guided | Articles |
|---|---|---|---|---|---|
| SWOT analysis | 🤖🌐 | – | ✓ | 4-Aspects Infographic Designer | |
| PEST analysis | 🤖🌐 | – | ✓ | 4-Aspects Infographic Designer | |
| PESTLE analysis | 🤖🌐 | – | ✓ | 4-Aspects Infographic Designer | |
| SOAR analysis | 🤖🌐 | – | ✓ | 4-Aspects Infographic Designer | |
| TOWS analysis | 🌐 | – | ✓ | 4-Aspects Infographic Designer | |
| 5C’s analysis | 🌐 | – | – | 4-Aspects Infographic Designer | |
| Porter’s five forces analysis | 🌐 | – | – | 5-Aspects Infographic Designer | |
| McKinsey 7S model | 🤖🌐 | – | ✓ | 7-Aspects Infographic Designer | |
| VRIO framework | 🌐 | – | – | 4-Aspects Infographic Designer | |
| Johari window | 🌐 | – | – | 4-Aspects Infographic Designer |
Growth & Portfolio Strategy Support Matrix
Visual Paradigm accelerates growth strategy planning with AI-assisted matrices and canvases for market expansion, portfolio management, and marketing frameworks. See platform coverage for Ansoff Matrix, Blue Ocean Strategy, BCG Matrix, Marketing Mix (4Ps), Marketing Mix (4Cs), 7P Marketing Mix, AIDA Model, and Balanced Scorecard – many with dedicated guided AI web apps and report generation.
| Feature | VP Desktop Visual Modeling | OpenDocs Casual Diagramming | Chatbot Visual Model Co-Pilot | Web Apps Step-by-Step, Guided | Articles |
|---|---|---|---|---|---|
| Ansoff matrix | 🤖🌐 | – | ✓ | 4-Aspects Infographic Designer | |
| Blue ocean strategy | 🤖🌐 | – | ✓ | 4-Aspects Infographic Designer | |
| BCG matrix | 🌐 | – | – | 4-Aspects Infographic Designer | |
| Marketing mix (4Ps) | 🌐 | – | – | 4-Aspects Infographic Designer | |
| Marketing mix (4Cs) | 🤖 | – | ✓ | – | |
| 7P marketing mix | 🌐 | – | – | 7-Aspects Infographic Designer | |
| AIDA model | 🌐 | – | – | 4-Aspects Infographic Designer | |
| Balanced scorecard | 🌐 | – | – | 4-Aspects Infographic Designer |
Prioritization & Execution Support Matrix
Teams rely on Visual Paradigm for AI-powered prioritization and execution frameworks that help turn strategy into actionable plans. This table shows support levels for Eisenhower Matrix (Urgency-Importance), RACI Matrix, Effort-Impact Matrix, SMART Goals, PDCA, Hoshin Kanri Matrix, and DMAIC Framework across Desktop, Chatbot Co-Pilot, OpenDocs, and specialized AI web tools.
| Feature | VP Desktop Visual Modeling | OpenDocs Casual Diagramming | Chatbot Visual Model Co-Pilot | Web Apps Step-by-Step, Guided | Articles |
|---|---|---|---|---|---|
| Eisenhower matrix | 🤖🌐 | – | ✓ | 4-Aspects Infographic Designer | |
| RACI matrix | 🌐 | – | – | 4-Aspects Infographic Designer | |
| Effort-Impact matrix | 🌐 | – | – | 4-Aspects Infographic Designer | |
| SMART goals | 🌐 | – | – | 5-Aspects Infographic Designer | |
| PDCA | 🌐 | – | – | 4-Aspects Infographic Designer | |
| Hoshin Kanri matrix | 🌐 | – | – | 4-Aspects Infographic Designer | |
| DMAIC framework | 🌐 | – | – | 5-Aspects Infographic Designer |
General Diagrams Support Matrix
Visual Paradigm supports a wide range of general-purpose and project visualization diagrams ideal for roadmaps, processes, and team communication. Check the matrix for availability of Breakdown Structure Diagram, Migration Roadmap, Enhanced PERT Chart, Flowchart, Mind Mapping Diagram, Markmap Diagram, Organization Chart, Cause and Effect Diagram (Fishbone), PERT Chart, Implementation Diagram, and Roadmap Diagram on our four platforms.
| Feature | VP Desktop Visual Modeling | OpenDocs Casual Diagramming | Chatbot Visual Model Co-Pilot | Web Apps Step-by-Step, Guided | Articles |
|---|---|---|---|---|---|
| Infographic | 🌐 | – | – | ||
| Breakdown structure diagram | 🖥📖 | ✓ | – | – | |
| PERT chart | 🖥📖🤖 | ✓ | ✓ | – | 📎 |
| KPI performance diagram | 🌐 | – | – | AI-Powered KPI Performance Diagram Builder | |
| Flowchart | 🖥📖 | ✓ | – | – | 📎 |
| Mind mapping diagram | 🖥📖🤖🌐 | ✓ | ✓ | ||
| Markmap diagram | 🌐 | – | – | AI-Powered Markmap Studio | |
| Organization chart | 🖥📖🤖 | ✓ | ✓ | – | |
| Cause and effect diagram | 🖥📖 | ✓ | – | – | |
| Implementation plan diagram | 🖥 | – | – | – | |
| Migration roadmap | 🖥 | – | – | – | |
| Tree diagram | 📖🌐 | ✓ | – | AI Tree Diagram Maker | |
| Timeline | 📖 | ✓ | – | – | |
| Family tree | 📖 | ✓ | – | – | |
| Concept map | 📖 | ✓ | – | – |
Data Visualization Support Matrix
For clear data communication, Visual Paradigm offers AI chart generation capabilities across common visualization types. This final matrix lists support for Radar Chart, Bar Chart, Line Chart, Area Chart, Pie Chart, and Scatter Chart – with strongest conversational AI chart creation in the Chatbot Co-Pilot and growing capabilities in other platforms.
| Feature | VP Desktop Visual Modeling | OpenDocs Casual Diagramming | Chatbot Visual Model Co-Pilot | Web Apps Step-by-Step, Guided | Articles |
|---|---|---|---|---|---|
| Data Visualization | 🖥🤖🌐 | – | AI-Powered Charts: | AI-Powered BI Analytics |
Keys
- 🖥 Desktop : This diagram type is supported by the Desktop Diagram Generation tool in Visual Paradigm Desktop.
- 📖 OpenDoc : This diagram type is supported through OpenDocs within Visual Paradigm (runs inside Visual Paradigm Desktop and is embedded in the application).
- 🤖 AI Chatbot: This diagram type is supported through the AI Chatbot within Visual Paradigm (runs inside Visual Paradigm Desktop and is embedded in the application).
- 🌐 Web App: This diagram type is supported through a web app within Visual Paradigm (runs inside Visual Paradigm Desktop and is embedded in the application).