


What is a State Diagram?
A state diagram is a graphical representation of the various states that an object or system can be in and the transitions between those states in response to events or conditions. It provides a high-level view of the system’s behavior over time. A state diagram in UML (Unified Modeling Language) is a graphical representation of the various states that an object or system can be in and the transitions between those states in response to events or conditions. State diagrams are used to model the behavior of objects or systems over time. They are particularly useful for representing complex systems, software applications, and control systems.
Why use State Diagrams?
State diagrams help in visualizing and understanding the dynamic behavior of a system. They are particularly useful for modeling systems with complex state transitions, such as software applications, control systems, and even real-world objects like a vending machine. State diagrams in UML are valuable for various reasons, making them a crucial tool in system modeling and design. Here are the key benefits and reasons to use state diagrams, presented in bullet points:
- Visualization: State diagrams provide a visual representation of a system’s behavior over time, making it easier to understand complex processes and states.
- Clarity: They offer a clear and concise way to depict the possible states a system can be in and how it transitions between them.
- Behavior Modeling: State diagrams excel at modeling the dynamic behavior of objects or systems, including software applications and control systems.
- Synchronization: State diagrams help synchronize and coordinate the behavior of different parts of a system, especially in concurrent or parallel systems.
- Identification of States: They help identify all possible states that a system can exist in, leaving no ambiguity in system behavior.
- Event-Driven: State diagrams are inherently event-driven, making them suitable for systems that respond to events or triggers.
- Validation and Verification: They aid in validating and verifying system requirements by ensuring that the system behaves as expected under different conditions.
- Testing: State diagrams serve as a basis for designing test cases, helping ensure comprehensive testing of a system’s behavior.
- Communication: They facilitate effective communication among stakeholders, including developers, designers, and domain experts, by providing a common visual language.
- Design and Implementation: State diagrams can be used as a blueprint for designing and implementing the system, ensuring that the code aligns with the specified behavior.
- Error Detection: They make it easier to identify potential errors or oversights in the system’s behavior before implementation.
- Maintenance: State diagrams assist in understanding and maintaining complex systems, aiding in troubleshooting and updates.
- Documentation: They serve as documentation artifacts that capture and communicate the system’s dynamic behavior for future reference.
State diagrams in UML are a powerful tool for modeling and understanding the dynamic behavior of systems, facilitating effective communication, design, testing, and maintenance throughout the system development lifecycle.
Basic Components of a State Diagram
In UML state diagrams, the following notations are commonly used:
- Simple State: Rectangles with rounded corners, labeled with the state name.
- Composite State: A state that contains substates, represented as a larger rectangle containing smaller states
- Concurrent State: A state that represents parallel or concurrent activities, usually depicted as multiple states stacked vertically.
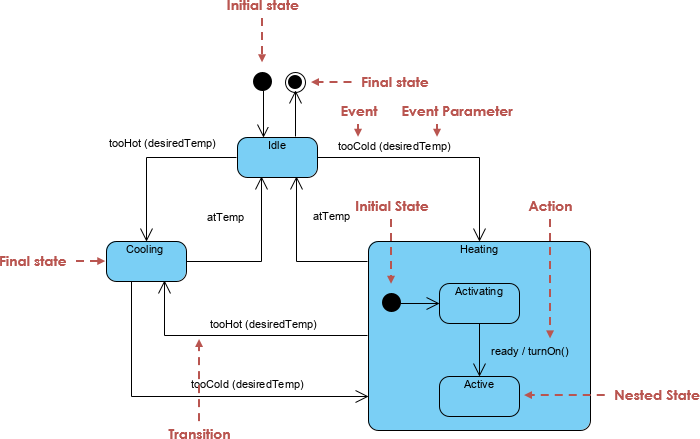
- Initial State: A filled black circle with an arrow pointing to the initial state.
- Final State: A filled circle with a dot inside.
- Transition: Arrows connecting states, labeled with events and actions.
- State Names and Labels: State names should be descriptive and reflect the meaning of the state. Labels can be used to provide additional information about a state or transition.
- Transitions: Transitions are represented as arrows connecting states. They are labeled with the event that triggers the transition and actions that occur during the transition.
- Events and Actions: Events are labeled on transitions to indicate what triggers the state change. Actions can be associated with transitions to describe what happens when the transition occurs.
- Initial and Final States: Initial states are depicted as filled black circles with an arrow pointing to the initial state. Final states are represented as filled circles with a dot inside.
Creating a State Diagram
Identifying the System or Object to Model:
Begin by identifying the system, object, or process you want to model with a state diagram. Clearly define its behavior and the states it can be in.
- Defining States:
- List all the possible states that the system can be in. Use simple, descriptive names for each state and represent them as rectangles with rounded corners.
- Identifying Events and Actions:
- Determine the events or conditions that trigger state transitions. Also, identify the actions or operations that occur when a transition takes place.
- Creating Transitions:
- Draw transitions between states to represent how the system moves from one state to another in response to events. Label transitions with the triggering event and any associated actions.
- Adding Initial and Final States:
Include an initial state to indicate where the system’s behavior begins. Also, add a final state to represent the end of the system’s behavior.
A Traffic Light System with State Diagram:
Let’s walk through a simple example of a traffic light system to illustrate the concepts discussed so far.
- States:
- Red Light
- Yellow Light
- Green Light
- Transitions:
- Red Light -> Green Light (on “Green Light” event)
- Green Light -> Yellow Light (on “Yellow Light” event)
- Yellow Light -> Red Light (on “Red Light” event)
- Events and Actions:
- “Green Light” event turns on the green light and turns off the red light.
- “Yellow Light” event turns on the yellow light and turns off the green light.
- “Red Light” event turns on the red light and turns off the yellow light.
- Initial and Final States:
- Initial State: Red Light (system starts with the red light on)
- Final State: None (traffic light system doesn’t have a defined end)
Advanced State Diagram Concepts:
- Nested States:
-
- Nested states allow you to represent complex behaviors within a state. A state can contain substates, and the system can transition between these substates. This is useful for modeling hierarchical or structured systems.
- Concurrent States:
- Concurrent states represent multiple activities that can occur simultaneously. Each concurrent state can have its own substates and transitions. This is used to model parallelism in a system, such as multi-threaded software applications.
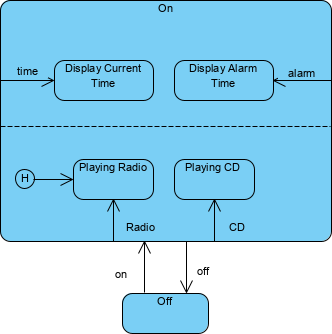
- Concurrent states represent multiple activities that can occur simultaneously. Each concurrent state can have its own substates and transitions. This is used to model parallelism in a system, such as multi-threaded software applications.
- History States:
- A history state remembers the previous state of a substate when it is entered. It is denoted by a small ‘H’ inside a circle. History states are useful for preserving the state hierarchy when re-entering a composite state.
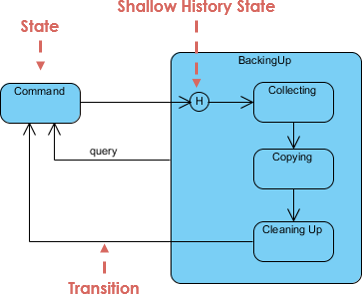
- A history state remembers the previous state of a substate when it is entered. It is denoted by a small ‘H’ inside a circle. History states are useful for preserving the state hierarchy when re-entering a composite state.
- Entry and Exit Actions:
- You can specify actions that occur when entering or exiting a state. Entry actions are executed when a state is entered, and exit actions are executed when leaving a state. These actions can be used to initialize or clean up resources associated with a state.
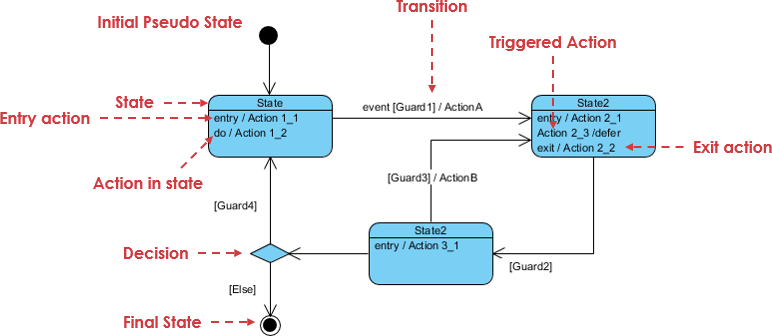
- You can specify actions that occur when entering or exiting a state. Entry actions are executed when a state is entered, and exit actions are executed when leaving a state. These actions can be used to initialize or clean up resources associated with a state.
- Guards:
- Guards are conditions that must be satisfied for a transition to occur. They are written in square brackets next to a transition label. Guards are used when the transition depends on specific conditions being met.
Best Practices for State Diagrams:
- Keep it Simple and Focused:
- Avoid overcomplicating state diagrams. Focus on modeling the essential behavior of the system. Use composite states and nested states judiciously to maintain clarity.
- Use Meaningful State Names:
- Choose descriptive state names that convey the purpose and meaning of each state. This makes it easier for stakeholders to understand the diagram.
- Maintain Consistency in Notation:
- Stick to standard UML notation and keep your diagrams consistent. Use the same symbols and labels throughout the diagram.
- Validate with Stakeholders:
- Collaborate with stakeholders, such as developers and domain experts, to ensure that the state diagram accurately reflects the system’s behavior and requirements.
Tools for Creating State Diagrams:
Several UML modeling tools are available for creating state diagrams, including:
- Visual Paradigm
- IBM Rational Rose
- Enterprise Architect
- Visio
You can also create state diagrams using drawing tools like Microsoft Visio or even draw them by hand on paper or a whiteboard.
Use Cases for State Diagrams:
State diagrams are valuable for modeling a wide range of systems, including:
- Software Systems: Modeling the behavior of software applications, especially those with complex user interfaces or stateful components.
- Embedded Systems: Describing the operation of hardware devices and controllers.
- Control Systems: Representing the behavior of automated control systems, such as robotics or industrial automation.
- Business Processes: Modeling the workflow and states of business processes and workflows.
- Communication Protocols: Describing the state transitions in communication protocols.
Common Mistakes to Avoid:
Overcomplicating the Diagram:
- Avoid adding unnecessary complexity to your state diagram. Stick to the essential states and transitions to maintain clarity.
Neglecting to Define All Possible States:
- Make sure you consider and define all possible states your system can be in. Neglecting states can lead to incomplete models.
Not Considering Concurrent Behaviors:
- If your system has parallel or concurrent activities, use concurrent states to represent them accurately.
Conclusion:
State diagrams are a powerful tool for modeling the dynamic behavior of systems and objects. They help stakeholders understand how a system responds to events and conditions over time. By following best practices and using UML notation consistently, you can create effective state diagrams that enhance the design and development of complex systems.
Readers will learn how to identify system behaviors, define states, specify events and actions, and create transitions between states. The guide includes a practical example of a traffic light system to illustrate these concepts. It also delves into advanced topics such as nested states, concurrent states, history states, entry and exit actions, and guards.
Best practices for designing effective state diagrams are highlighted, emphasizing simplicity, meaningful state names, and consistency in notation. The guide also explores common mistakes to avoid and offers insights into use cases for state diagrams in various domains.
Whether you are a software developer, system architect, or a business analyst, “Mastering State Diagrams in UML” equips you with the knowledge and skills to model dynamic behaviors accurately and effectively, enhancing your system design and development capabilities.