


Introduction:
Data Flow Diagrams (DFDs) are powerful tools for visualizing and understanding the flow of data within a system. Whether you’re a student learning about systems analysis or a professional working on a complex project, creating DFDs can help you gain insights into the data processes.
Creating DFD Step-by-Step
In this step-by-step guide, we’ll explore how to create Data Flow Diagrams using the Visual Paradigm online tool, offering a hands-on approach to learning through examples.
Step 1: Sign Up and Access Visual Paradigm Online Tool
The first step is to sign up for Visual Paradigm. You can access the tool online, eliminating the need for installations. Once registered, log in to your account to get started.
Step 2: Create a New Project
After logging in, create a new project by selecting “New Project” from the dashboard. Choose the type of project you want (e.g., System Analysis), and give it a meaningful name. This will serve as the container for your DFD.
Step 3: Access the Diagram Editor
Once your project is created, navigate to the diagram editor. Visual Paradigm provides an intuitive interface with drag-and-drop functionality, making it easy for users of all levels.
Step 4: Add External Entities
Identify the external entities interacting with your system. External entities could be people, other systems, or organizations that exchange data with your system. Use the symbol library in Visual Paradigm to drag and drop external entity shapes onto the canvas.
Step 5: Add Processes
Processes represent the actions or transformations that occur within the system. Add processes to your diagram by dragging the process shapes onto the canvas. Connect these processes to external entities using data flow arrows to illustrate the data flow between them.
Step 6: Define Data Stores
Identify where data is stored within the system by adding data stores. These could be databases, file systems, or any other repositories. Connect data stores to processes and external entities to show the movement of data.
Step 7: Connect Data Flows
Use arrows to represent data flows between external entities, processes, and data stores. Label these arrows to describe the nature of the data being exchanged. Visual Paradigm allows you to easily create and customize these data flows.
Step 8: Refine and Validate
Review your diagram for accuracy and completeness. Visual Paradigm offers validation features to ensure your DFD adheres to best practices. Make necessary adjustments and refinements based on the feedback.
Step 9: Generate Reports and Documentation
Once your DFD is complete, Visual Paradigm allows you to generate reports and documentation automatically. This is a valuable feature for communicating your system’s data flow to stakeholders and team members.
Step 10: Save and Share
Save your project and share it with collaborators or stakeholders. Visual Paradigm provides options for collaborative editing, making it easy for multiple team members to work on the same project simultaneously.
Conclusion:
Creating Data Flow Diagrams with Visual Paradigm is a straightforward process that combines the power of visualization with user-friendly design. By following this step-by-step guide and learning through examples, you can master the art of creating insightful DFDs for your projects. Visual Paradigm’s online tool provides a practical platform for honing your skills and efficiently communicating complex data flow structures within systems.
Learn DFD by Examples
Data Flow Diagram Examples
Data flow diagrams are widely used in the modeling of information systems. In this section, we collected some DFD examples for you as reference. You can create your own DFDs online with those examples, using Visual Paradigm Online.
General Data Flow Diagram Examples
Securities Trading Platform
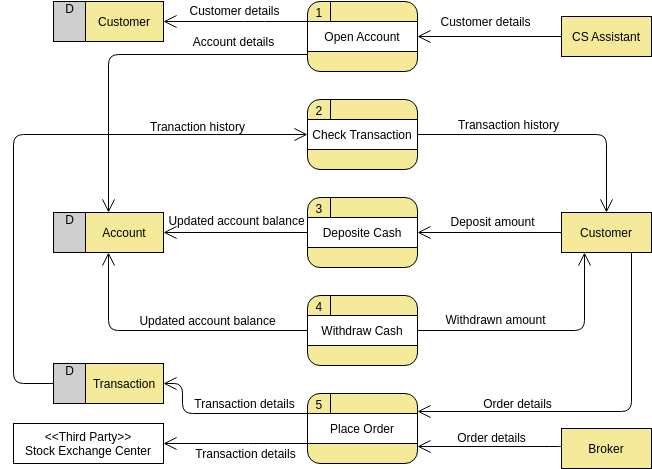
Edit this DFD example with our online DFD maker
Food Order System
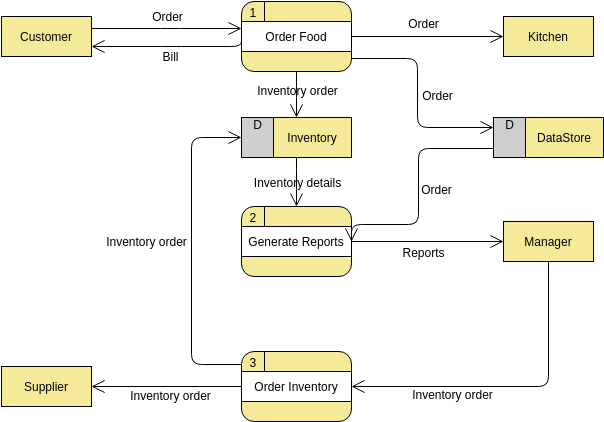
Edit this DFD example with our online DFD editor
Customer Service System
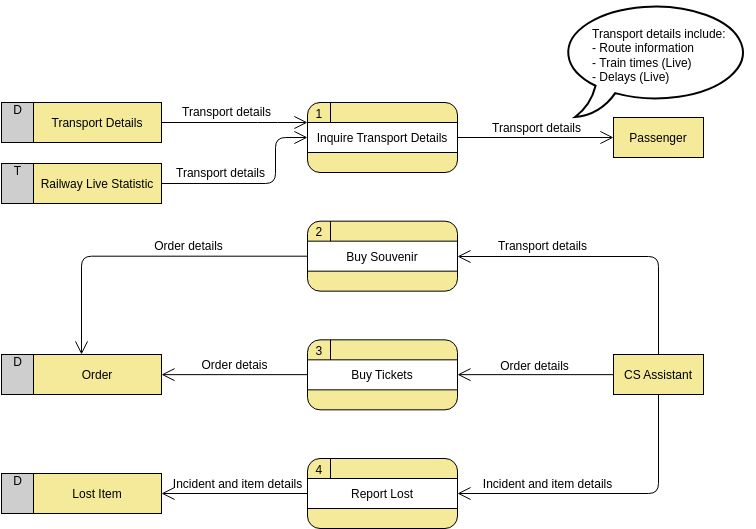
Edit this DFD example with our online Data Flow Diagram tool
Supermarket App
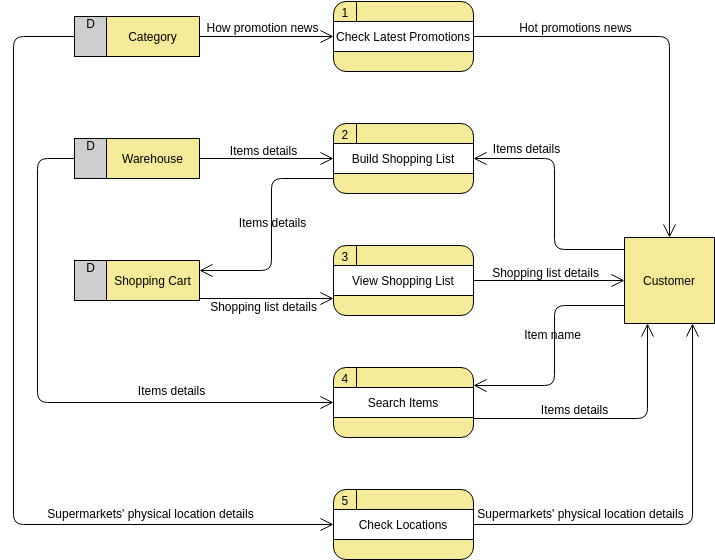
Edit this DFD example with our online Data Flow Diagram software
Vehicle Maintenance Depot
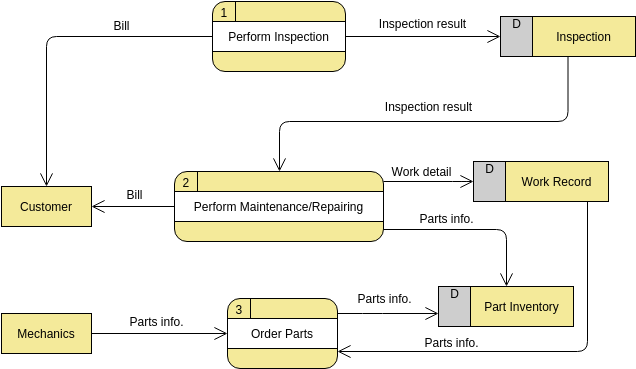
Edit this DFD example with our DFD maker
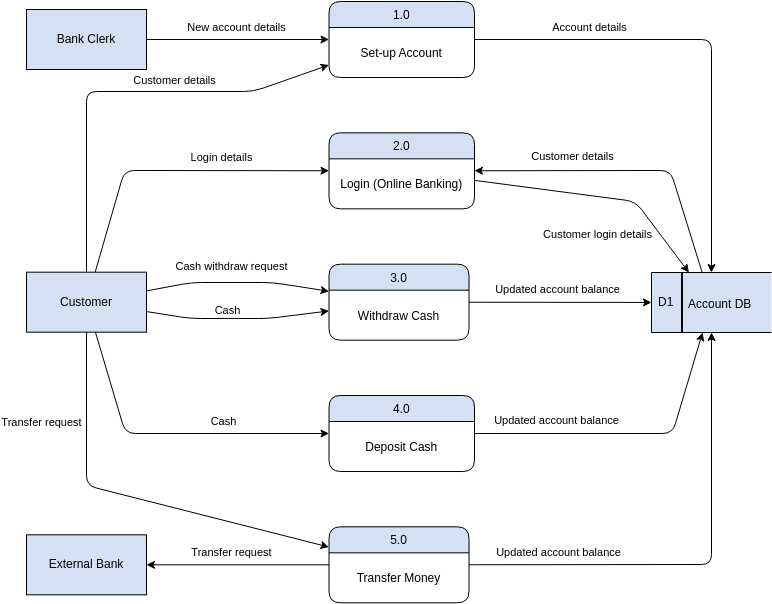
Yourdon and Coad DFD Examples
Level 1 DFD example
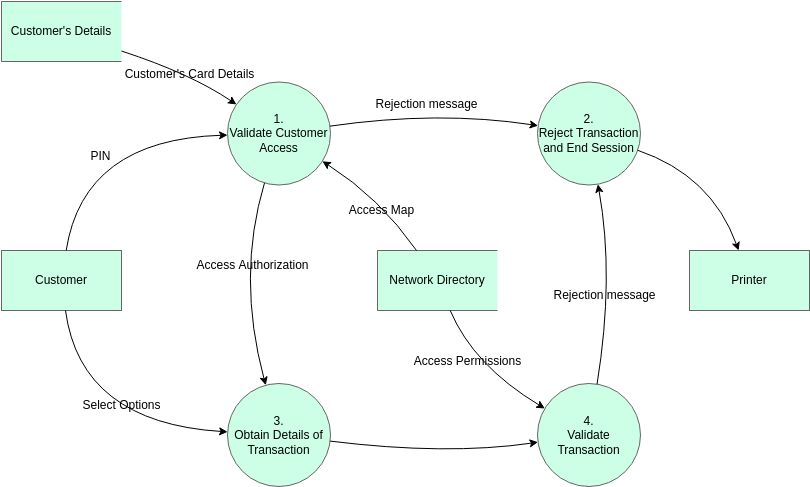
Edit this DFD example with our online DFD creator
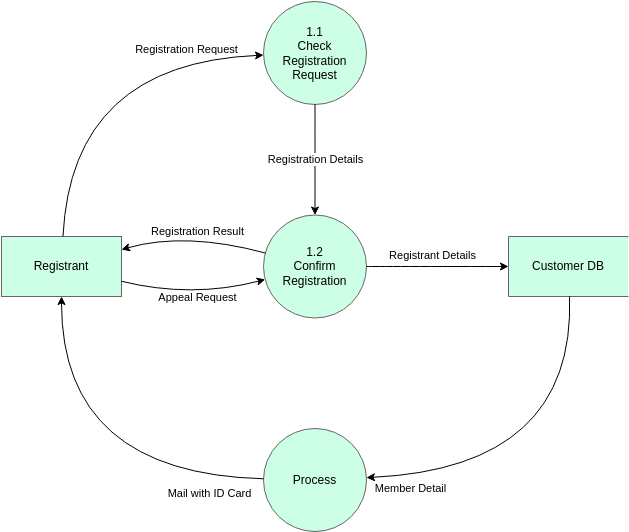
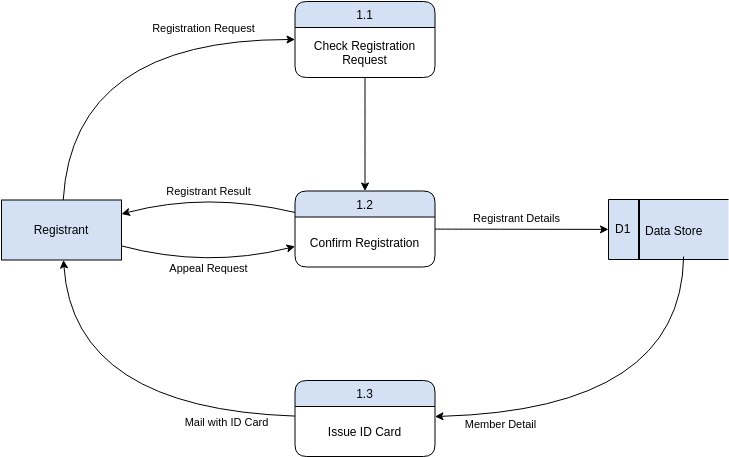
CS System Level 1 DFD Example
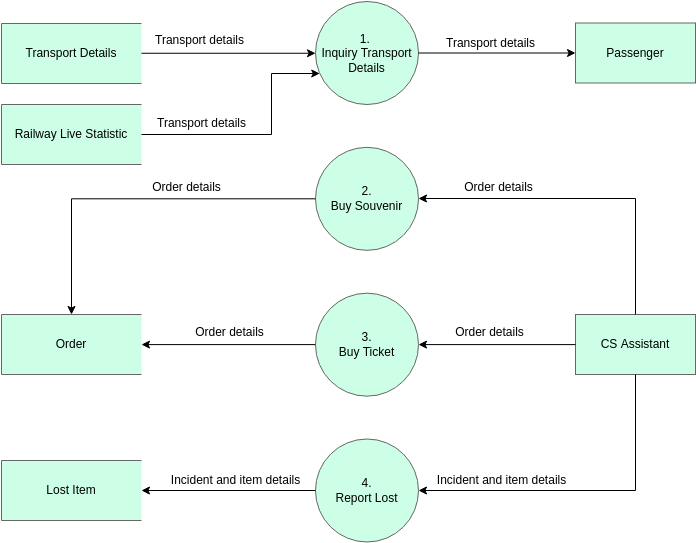
Edit this DFD example with our online DFD editor
General Yourdon and Coad DFD
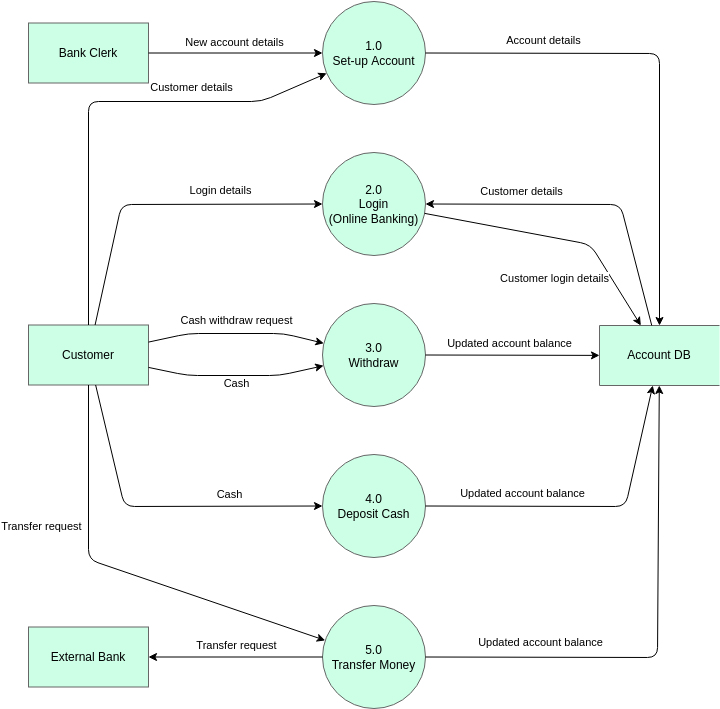
Edit this DFD example with our online Data Flow Diagram tool
Simple Yourdon and Coad Data Flow Diagram Example
Edit this DFD example with our online Data Flow Diagram software
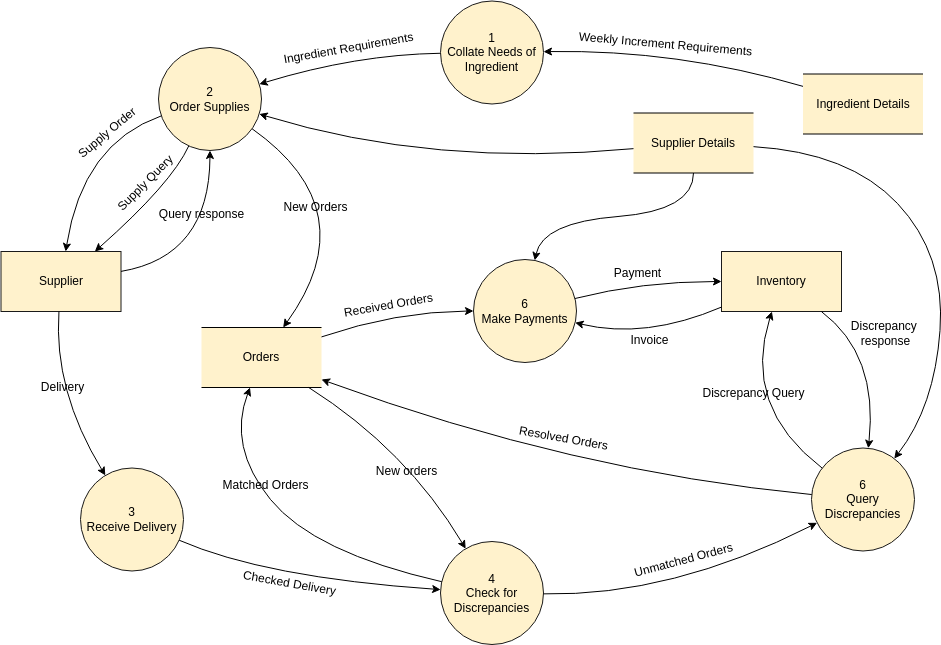
Inventory Management DFD Example
Edit this DFD example with our DFD maker
Yourdon DeMarco DFD Examples
Video Rental Shop Context Diagram Example
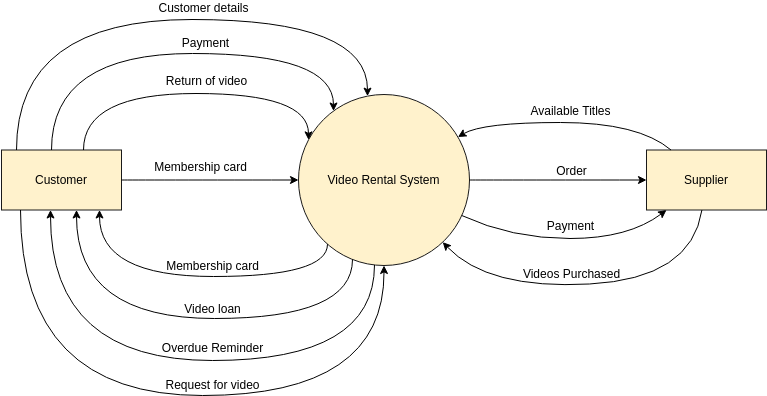
Edit this DFD example with our online DFD creator
Video Rental Shop Level 1 DFD Example
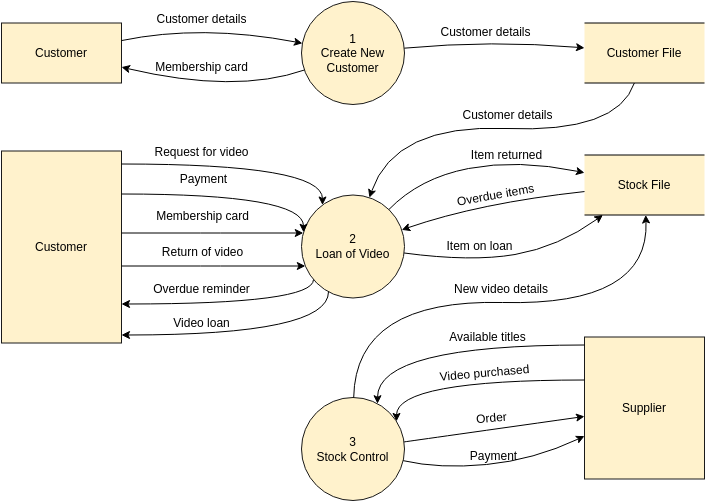
Edit this DFD example with our online Data Flow Diagram tool
DFD Online Shop Example
Edit this DFD example with our online DFD editor
Gane-Sarson DFD Examples
Simple Gane Sarson DFD Example
Edit this DFD example with our online DFD creator
Basic Gane Sarson Example
Edit this DFD example with our online DFD editor
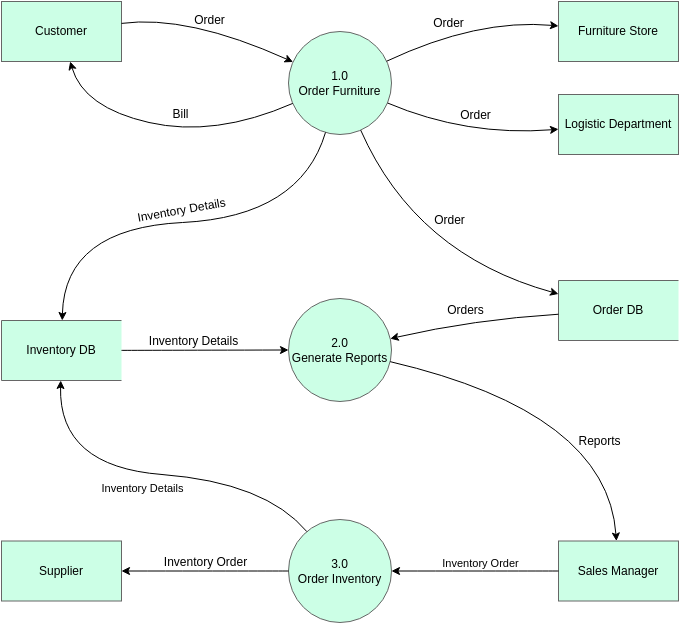
Furniture Order DFD Example
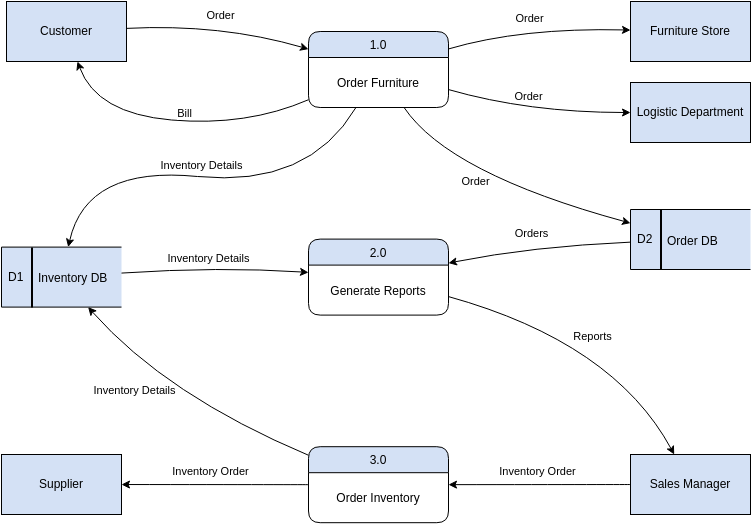
Edit this DFD example with our online Data Flow Diagram tool