

Mapping software artifacts to hardware topology (nodes) and physical connections
Deployment diagrams in UML 2.5 visualize the physical deployment of a software system onto hardware and network infrastructure. They show how software artifacts (executables, libraries, configuration files, databases, containers, microservices, etc.) are distributed across nodes (physical or virtual computing elements such as servers, workstations, mobile devices, cloud instances, IoT gateways, embedded controllers) and how these nodes are connected via communication paths (networks, protocols, buses).
Key elements:
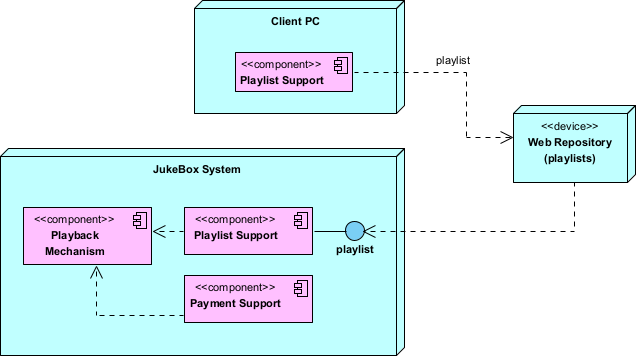
- Node — A 3D box (cube-like) representing a computational or physical resource (e.g., «device», «executionEnvironment», «node»). Stereotypes clarify type: «server», «cloudInstance», «mobileDevice», «container», «KubernetesPod».
- Artifact — A file or deployable unit (e.g., .jar, .war, .exe, Docker image, database schema) shown inside or manifested on a node.
- Communication Path — Solid line between nodes, often with stereotypes or protocols (e.g., «HTTP», «HTTPS», «MQTT», «LAN», «VPN», «5G»).
- Deployment — Shows which artifacts run on which nodes (manifestation or deployment relationship).
- Nested nodes — Nodes can contain other nodes (e.g., data center contains racks contains servers).
In Agile & use-case-driven projects, deployment diagrams are used:
- To make architectural decisions visible early (cloud vs. on-prem, scaling strategy, latency concerns)
- To attack deployment-related risks (single points of failure, network bottlenecks, security perimeters)
- To support DevOps discussions (CI/CD pipelines, container orchestration, monitoring)
- To evolve incrementally: start with logical nodes in early sprints, refine with real infrastructure details later
- To communicate topology to stakeholders, ops teams, and security auditors
Practical Examples of Deployment Diagrams in Real Projects
Here are numerous concrete examples across different system types and deployment styles:
- E-commerce Platform (Cloud-Native, Kubernetes-Based) Nodes:
- «Kubernetes Cluster» AWS EKS (contains multiple pods)
- Catalog Pod (manifests CatalogService.jar + ConfigMap)
- Order Pod (manifests OrderService.jar)
- Payment Pod (manifests PaymentService.jar)
- «Database» Amazon RDS PostgreSQL (manifests ecom-db schema)
- «CDN» CloudFront (manifests static assets: images, JS bundles)
- «Load Balancer» AWS ALB
- «Mobile Clients» (many «mobileDevice» nodes) Communication paths: HTTPS between clients → ALB → EKS pods; TCP 5432 between pods and RDS. Practical benefit: Reveals horizontal scaling needs for OrderService during sales events; highlights CDN usage to reduce latency.
- «Kubernetes Cluster» AWS EKS (contains multiple pods)
- Mobile Banking App (Hybrid Cloud + On-Prem Legacy) Nodes:
- «mobileDevice» iOS/Android Phones (manifests BankingApp.apk / .ipa)
- «cloudInstance» AWS EC2 (manifests API Gateway + Mobile Backend)
- «on-prem server» Mainframe (manifests CoreBankingLegacy.exe)
- «firewall» DMZ Edge
- «HSM» Hardware Security Module (for PIN/block encryption) Paths: HTTPS/TLS 1.3 (mobile → API Gateway); VPN tunnel (API Gateway → Mainframe); secure channel (API Gateway → HSM). Outcome: Exposes security perimeter and legacy integration risks early; guides zero-trust network design.
- Healthcare Telemedicine Platform Nodes:
- «cloudInstance» HIPAA-compliant AWS VPC (contains VideoService container)
- «on-prem hospital» EHR Server (manifests Epic/Cerner integration adapter)
- «mobileDevice» Patient App
- «web browser» Doctor Workstation
- «TURN/STUN Server» for WebRTC relay
- «Notification Service» Firebase Cloud Messaging Paths: WebRTC (peer-to-peer when possible, relayed via TURN); HTTPS to EHR via secure API gateway. Practical: Ensures PHI never traverses non-compliant paths; visualizes high-availability needs for video calls.
- IoT Smart Factory Monitoring System Nodes:
- «edge device» Industrial Gateway (Raspberry Pi / Siemens Edge, manifests EdgeCollector firmware)
- «on-prem server» Factory Data Center (manifests TimeSeriesDB InfluxDB)
- «cloudInstance» Azure IoT Hub (manifests AnalyticsService)
- «sensor network» Hundreds of «device» nodes (temperature, vibration sensors) Paths: MQTT over TLS (sensors → Gateway); OPC UA (Gateway → PLCs); HTTPS/AMQP (Gateway → Azure IoT Hub). Benefit: Highlights edge vs. cloud trade-offs (latency vs. advanced analytics); identifies offline resilience requirements.
- Task Management SaaS (Multi-Region Global Deployment) Nodes:
- «region» us-west-2 (AWS)
- «Kubernetes Cluster» (TaskService pods, Redis cache)
- «Database» Aurora PostgreSQL (multi-AZ)
- «region» eu-central-1 (AWS) — mirrored setup for EU users
- «CDN» CloudFront (global edge locations)
- «load balancer» Global Accelerator Paths: Anycast routing via Global Accelerator → nearest region; cross-region replication for database. Practical: Shows GDPR compliance via regional data residency; guides failover and latency optimization.
- «region» us-west-2 (AWS)
- Legacy Desktop Application Modernization (Strangler Pattern) Nodes:
- «workstation» Employee PC (manifests OldMonolith.exe – being replaced)
- «cloudInstance» New Microservices (OrderService.jar, ReportingService.jar)
- «reverse proxy» NGINX (routes /old → monolith, /new → cloud services)
- «database» Shared SQL Server (gradual migration) Paths: HTTP from workstation → reverse proxy → split routing. Outcome: Tracks progress of strangler fig migration; minimizes big-bang risk.
- Restaurant POS & Online Ordering Hybrid System Nodes:
- «tablet» In-Store POS Terminal (manifests POSClient.app)
- «cloudInstance» CentralOrderService (AWS ECS)
- «kitchen display» «device» (manifests KitchenDisplay.exe)
- «mobileDevice» Customer App
- «payment terminal» Hardware (manifests PaymentAdapter) Paths: WebSocket (real-time order updates to kitchen); HTTPS (online orders to central service). Practical: Ensures offline mode for POS during internet outage; visualizes payment PCI scope.
In Visual Paradigm:
- Drag Node and Artifact from toolbox.
- Use manifestation (dashed arrow with filled triangle) to show artifacts deployed on nodes.
- Add communication paths with protocol stereotypes.
- Nest nodes for hierarchy (data center → rack → server).
- Semantic backplane links deployment elements to components/classes/use cases for full traceability.
Deployment diagrams answer: “Where does the software physically run, and how are the runtime pieces connected?” — making infrastructure decisions explicit, exposing operational risks early, and aligning architecture with real-world constraints in Agile iterations.
This completes the set of structural diagrams, preparing you for custom extensions with Profile Diagrams next.