


What is a State Diagram
State chart diagrams, also known as state machine diagrams, are a popular visual modeling tool used in software engineering to represent the behavior of complex systems. A state chart diagram describes the various states that a system can be in and the events or conditions that cause transitions between states. It is a powerful modeling tool that can be used in a variety of applications, including software development, control engineering, and business process modeling. In this comprehensive guide, we will explore the key concepts and elements of state chart diagrams, as well as how to develop them for different types of systems.
State diagrams are a part of the Unified Modeling Language (UML), which is a general-purpose, visual modeling language used to represent software systems. State diagrams are one of the UML’s behavioral diagrams, which are used to model the dynamic behavior of a system. Other behavioral diagrams in UML include activity diagrams, use case diagrams, and sequence diagrams. State diagrams are commonly used in software engineering to model the behavior of complex systems, such as embedded systems or network protocols, where the system’s behavior depends on its current state and the inputs it receives. State diagrams are a valuable tool for communicating design ideas and requirements between software developers, system architects, and stakeholders.
When to Use State Diagrams
State diagrams can be used to model the dynamic behavior of any system that has a finite number of states and state transitions. Some examples of systems that can be modeled using state diagrams include:
- Software systems: State diagrams can be used to model the behavior of software systems, such as user interfaces, control systems, and communication protocols.
- Hardware systems: State diagrams can also be used to model the behavior of hardware systems, such as electronic circuits, mechanical devices, and manufacturing processes.
- Biological systems: State diagrams can be used to model the behavior of biological systems, such as the immune system, neural networks, and biochemical pathways.
- Business processes: State diagrams can be used to model the behavior of business processes, such as order processing, inventory management, and customer service.
In general, any system that can be described in terms of discrete states and state transitions can be modeled using a state diagram. The power of state diagrams lies in their ability to capture the complexity of a system’s behavior in a simple, visual way, making them a valuable tool for system modeling and analysis.
The Elements of State Diagrams
The elements of state diagrams are the graphical components that are used to represent the states, transitions, inputs, and outputs of a finite state machine. Here is a brief explanation of each of these elements:
- States: States represent the conditions or situations that a system can be in at any given time. They are represented by circles or ovals in a state diagram. Each state should be labeled with a name or description that makes it clear what the state represents.
- Transitions: Transitions represent the changes from one state to another in response to an input. They are represented by arrows or lines in a state diagram. Each transition should be labeled with the input or event that triggers the transition.
- Inputs: Inputs represent the events or conditions that trigger a transition from one state to another. They can be represented by labels on the arrows or lines in a state diagram.
- Outputs: Outputs represent the actions or results that occur when a transition is made. They are not always included in a state diagram, but can be represented by labels on the arrows or lines, or in the states themselves.
- Initial State: The initial state is the state in which the system starts before any inputs are received. It is represented by an arrow pointing to the initial state circle or oval.
- Final State: The final state is the state that the system transitions to when it has completed its task. It is represented by a double circle or oval.
By using these elements in a state diagram, you can model the dynamic behavior of a system in a way that is clear, concise, and easy to understand. State diagrams are a powerful tool for software engineers and other professionals who need to model and analyze systems with a finite number of states and state transitions.
Drawing State Diagrams
Developing a state diagram based on a problem involves several steps. Here is a general process that you can follow:
- Identify the problem: Clearly identify the problem that you want to model using a state diagram. Understand the inputs, outputs, and states of the system.
- Define the states: Identify all possible states that the system can be in, including the initial and final states. Use clear and concise labels to describe each state.
- Define the inputs and outputs: Identify the inputs or events that cause the system to transition from one state to another. Define the outputs or actions that occur as a result of each transition.
- Create the state transitions: Using arrows or lines, connect each state to the next state that the system transitions to when an input or event occurs. Label each transition with the input or event that triggers it.
- Refine the state diagram: Review and refine the state diagram to ensure that it accurately models the system and includes all relevant information. Simplify the diagram as much as possible to make it easier to read and understand.
- Test the state diagram: Test the state diagram by simulating different inputs or events and tracing the path of the system through the states. Make sure that the outputs or actions that occur are consistent with the expected behavior of the system.
- Update the state diagram: Update the state diagram as needed based on the results of testing and feedback from stakeholders.
By following these steps, you can develop a state diagram that accurately models the behavior of a system and helps you better understand the problem at hand. Remember to keep the diagram clear and concise, and to seek feedback from others to ensure that the model accurately represents the system.
Interpreting State Diagrams
To interpret a state diagram, follow these steps:
- Identify the initial state: The initial state is the state that the system begins in before any inputs are received. This state is labeled in the diagram.
- Follow the transitions: Starting from the initial state, follow the transitions in the diagram in response to the inputs. Each transition leads to a new state, which represents the system’s new condition or situation.
- Understand the outputs: As the system transitions from one state to another, it may produce outputs that affect the system or its environment. These outputs can be inferred from the diagram or explicitly labeled on the transitions or states.
- Identify any loops or cycles: A loop or cycle
Example: Digital Clock
Problem description: Develop a state diagram for a digital clock that can display hours, minutes, and seconds.
The clock should have the following features:
- The clock should display the current time in hours, minutes, and seconds.
- The user should be able to set the time using buttons for hours, minutes, and seconds.
Develop a State Diagram Based on the Description
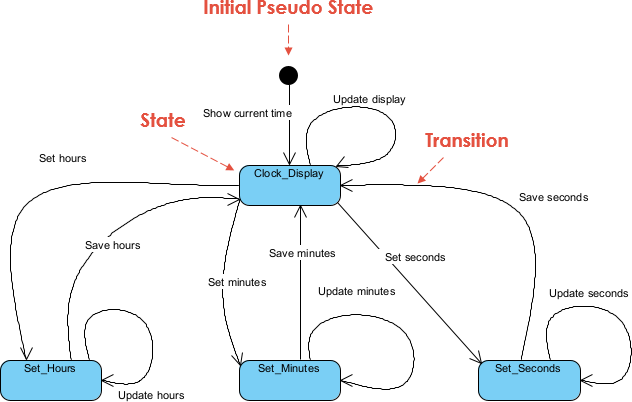
Interpretation
- The state diagram now starts with an initial state “Clock_Display” that shows the current time.
- The user can set the hours, minutes, or seconds by transitioning to the corresponding “Set” state.
- Once the user sets the hours, minutes, or seconds, the clock transitions back to the “Clock_Display” state and saves the new time.
- The “Update Display” action is triggered after any state transition to refresh the display with the current time.
This state diagram models the behavior of a digital clock with the basic functionality of setting and displaying the time. It shows the various states that the clock can be in and the transitions that occur when the user interacts with the clock.
Another Example: Vending Machine
Problem: Develop a state diagram for a vending machine that sells snacks and drinks. The vending machine accepts coins and bills, and the prices of the items are fixed. The vending machine should give change if the user inserts excess amount.
Requirements:
- The vending machine should have a display to show the user how much money they have inserted and the price of the selected item.
- The user should be able to select an item from a list of available items.
- The vending machine should check if the user has inserted enough money to buy the selected item.
- If the user inserts too much money, the vending machine should give change.
- If the user inserts insufficient money, the vending machine should show a message to insert more coins/bills.
- The vending machine should dispense the selected item if the user has inserted enough money and give change if necessary.
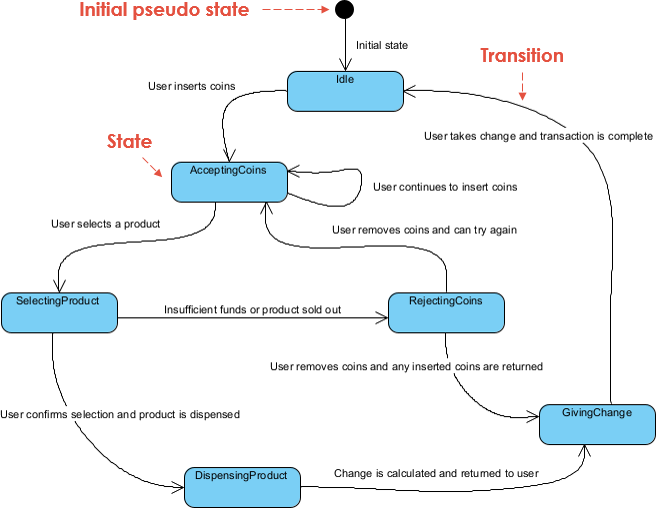
Based on these requirements, we can develop a state diagram for the vending machine that shows the different states that the machine can be in and the transitions that occur when the user interacts with the machine.
Develop the State Chart Diagram for the Vending Machine
Interpretation
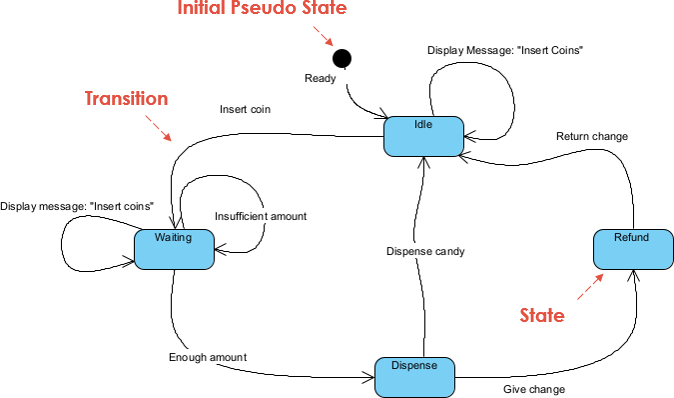
This state diagram models the behavior of a vending machine that dispenses candy bars and gives change if the user inserts excess amount. It shows the various states that the machine can be in and the transitions that occur when the user interacts with the machine.
- The state diagram starts with an initial state “Idle” that shows a message to the user to insert coins.
- The user can insert a coin, which transitions the vending machine to the “Waiting” state.
- If the user inserts an insufficient amount of money, the vending machine stays in the “Waiting” state and shows a message to the user to insert more coins.
- If the user inserts enough money to buy a candy, the vending machine transitions to the “Dispense” state.
- In the “Dispense” state, the vending machine checks if the user has inserted enough money to buy the candy. If so, it dispenses the candy and gives change if necessary. If not, it transitions back to the “Waiting” state and shows a message to the user to insert more coins.
- If change needs to be given to the user, the vending machine transitions to the “Refund” state and gives the change.
- After dispensing the candy or returning the change, the vending machine transitions back to the “Idle” state to wait for the next customer.
This state diagram models the behavior of a vending machine that dispenses candy bars and gives change if the user inserts excess amount. It shows the various states that the machine can be in and the transitions that occur when the user interacts with the machine.
Summary
State chart diagrams are a visual modeling tool used to represent the behavior of complex systems. In this comprehensive guide, we provide an overview of the key concepts and elements of state chart diagrams, as well as a step-by-step guide for developing them for different types of systems.
To illustrate the process, we provide two simple examples and draw the state chart diagrams for each. The first example is a digital clock that displays the time in hours, minutes, and seconds. The state chart diagram depicts the clock’s various states, such as “set time” and “display time”, and the transitions between them.
The second example is a vending machine that sells snacks and drinks. The state chart diagram shows the different states that the vending machine can be in, such as “idle” and “dispense item”, as well as the events or conditions that cause transitions between those states.
By following the step-by-step guide and understanding the key elements of state chart diagrams, readers will be able to develop effective diagrams to model and design complex systems in a variety of fields.
Related posts:
Visualizing System Behavior: A Practical Guide to State Diagrams with Examples
 From Use Case to MVC Framework: A Guide Object Oriented System Development
 Streamlining GourmetReserve App Design: Why Use Case Modeling Studio Beats Traditional UML Tools
 AI Component Diagram Generator: How Visual Paradigm Powers Your Modeling Workflow