


Introduction:
Data Flow Diagrams (DFDs) serve as powerful tools for visualizing how information moves through a system. However, to harness their full potential, it’s crucial to master the art of balancing. Balancing ensures that DFDs remain consistent, accurate, and easily comprehensible at every level of abstraction. In this comprehensive guide, we’ll walk you through a step-by-step process to achieve a harmonious and well-organized representation of data flows.
Balancing in Data Flow Diagrams (DFD) is essentially about maintaining consistency and coherence across different levels of diagrams. The purpose of balancing is to ensure that the information and data flows remain accurate, complete, and well-organized throughout the system representation.
When you expand a higher-level process into a lower-level diagram, you need to make sure that all the inputs and outputs of the higher-level process are correctly reflected in the lower-level diagram. This means that every input to the process at the higher level should be an input to the same process at the lower level, and similarly for outputs.
Here’s why balancing is important:
- Consistency: It ensures that the information presented in different levels of diagrams is consistent. Users should be able to trace inputs and outputs seamlessly from the highest level (context diagram) down to the lowest level.
- Completeness: It helps maintain completeness in data representation. Every piece of information that enters or exits a process should be accounted for at each level of abstraction.
- Accuracy: Balancing ensures the accuracy of data flow representations. If a new input or output is identified during the design or analysis phase, it needs to be systematically added to all relevant levels to maintain accuracy.
- Traceability: It facilitates traceability of data flows. This is crucial for understanding how data moves through the system and for identifying any discrepancies or missing elements.
- Ease of Understanding: Balanced diagrams are easier to understand and interpret. They provide a clear and organized view of how data moves through the system without any ambiguities.
Balancing in DFD is a practice that ensures the integrity and coherence of the diagrams, making them effective tools for understanding and communicating the flow of information within a system. It allows for flexibility in making changes while maintaining a structured and interconnected representation of data flows.
Balancing Data Flow Diagrams in 10 Steps
Step 1: Develop the Context Diagram
Begin by creating a context diagram that provides a high-level overview of the entire system. Identify the main processes and external entities involved.
Step 2: Expand to Level 1 Diagrams
For each process identified in the context diagram, create corresponding Level 1 diagrams. Define the inputs and outputs of each process, ensuring they align with the context diagram.
Step 3: Maintain Input-Output Consistency
When expanding a process from a higher level to a lower level, ensure that all inputs and outputs at the higher level are accurately represented in the lower level. No additional inputs or outputs should be introduced unless they are part of the lower-level process.
Step 4: Check for Completeness
Verify that all inputs and outputs present in the context diagram are accounted for in the Level 1 diagrams. Every data flow entering or leaving the system should be included in the detailed diagrams.
Step 5: Allow for Necessary Modifications
Recognize that adjustments may be needed during the design phase. If a new input or output is identified, add it to the relevant process at the lower level. Ensure that this modification is reflected in all higher-level diagrams.
Step 6: Iterative Balancing
Balancing is an iterative process. As you move to lower levels of abstraction, consistently check and balance the diagrams. Confirm that the data flows are accurately represented, and make adjustments as necessary.
Step 7: Document Changes
Clearly document any changes made during the balancing process. Note the reasons for modifications, whether it’s the addition of a new data flow or the removal of an obsolete one. This documentation aids in understanding the evolution of the system representation.
Step 8: Validate and Review
Periodically validate and review the balanced diagrams with stakeholders and team members. This ensures that everyone has a shared understanding of the system’s data flows and helps identify any discrepancies or misunderstandings.
Step 9: Ensure Traceability
Maintain traceability throughout the diagrams. Users should be able to trace a data flow from the context diagram down to the lowest level without confusion. Traceability enhances the overall clarity of the system representation.
Step 10: Finalize and Publish
Once the balancing process is complete, finalize the diagrams and publish them as part of the system documentation. These balanced DFDs serve as valuable tools for system analysis, design, and communication.
By following these steps, software engineers and system analysts can ensure that their Data Flow Diagrams are balanced, accurate, and provide a comprehensive representation of how data moves through a system.
Summary
Balancing Data Flow Diagrams is a systematic and iterative process that begins with the development of a context diagram and extends to detailed Level 1 diagrams. This step-by-step guide emphasizes the importance of maintaining input-output consistency, checking for completeness, and allowing for necessary modifications during the design phase. The iterative nature of balancing ensures that changes are documented, validated, and reviewed, leading to a finalized set of DFDs that offer clarity, accuracy, and traceability. Whether you’re a software engineer, system analyst, or stakeholder, mastering DFD balancing enhances your ability to understand, communicate, and design efficient information flow within a system.
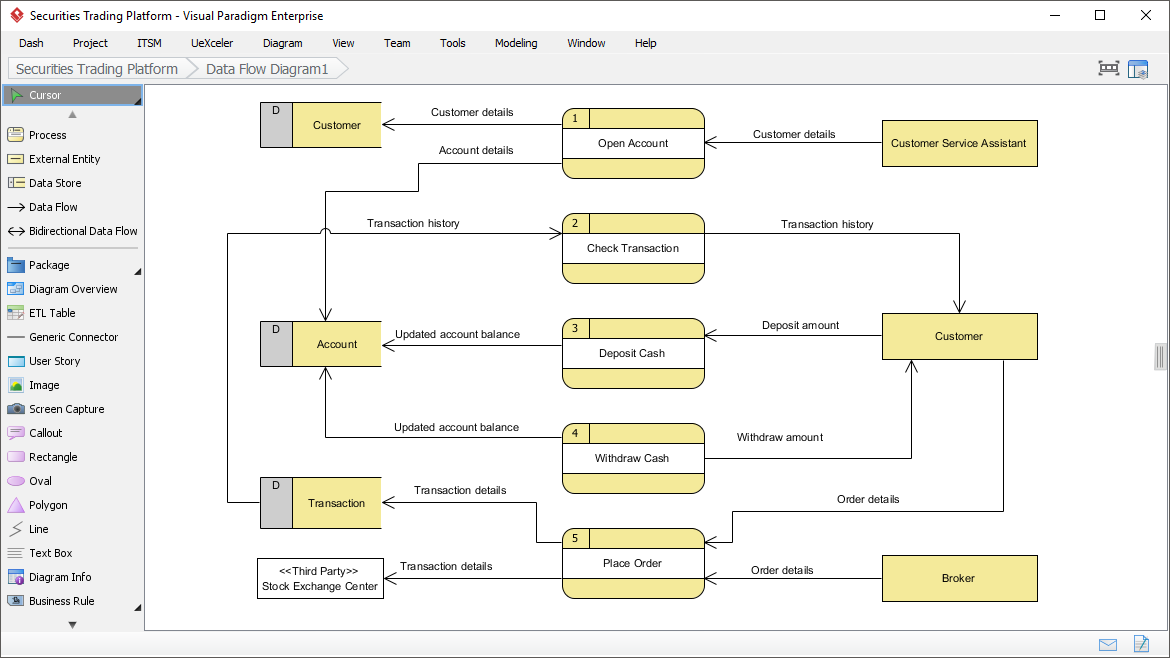
Visual Paradigm’s Easy-to-Use Data Flow Diagram Editor
Introduction:
Unlock the power of visualizing information flow within your systems with Data Flow Diagrams (DFDs). Visual Paradigm presents a user-friendly DFD editor that simplifies the creation process, allowing you to effortlessly map out how information moves through your system. Whether you’re identifying inputs and outputs, or specifying the information needed for a particular process, our editor provides a seamless experience.
Key Features:
- Drag-and-Drop Shape Creation: Easily build your DFD with an intuitive drag-and-drop interface. Effortlessly add processes, entities, and data flows to create a comprehensive representation of your system.
- Precise Shape Positioning: Achieve pixel-perfect precision with alignment guides. Position elements exactly where you want them for a clean and organized diagram.
- Element Reusability: Save time and maintain consistency by reusing elements across your diagrams. Efficiently represent recurring processes or entities without starting from scratch.
- Modeling Simplicity: Visual Paradigm streamlines the modeling process, making it accessible to both beginners and seasoned professionals. Create DFDs quickly and accurately without a steep learning curve.
Why Visual Paradigm?
Our DFD editor is designed to meet the diverse needs of system designers, analysts, and stakeholders. Whether you’re conceptualizing a new system or refining an existing one, Visual Paradigm’s editor empowers you with a robust set of features for a hassle-free modeling experience.
Transform your ideas into visual representations with Visual Paradigm’s Easy-to-Use Data Flow Diagram Editor – where simplicity meets sophistication.