


UML Deployment Diagrams: Modeling Distributed System Architecture
A UML Deployment Diagram is a type of diagram in the Unified Modeling Language (UML) that is used to model the physical deployment of software components and their relationships in a system. It primarily focuses on representing the hardware and software nodes in a system and how software artifacts are allocated to those nodes. While deployment diagrams can be useful for modeling parts of a distributed system, they may have limitations when modeling a fully distributed system.
Here are some key points to consider when using UML Deployment Diagrams for modeling distributed systems:
- Physical Representation: Deployment diagrams are well-suited for modeling the physical aspects of a distributed system, such as the allocation of software components to hardware nodes or servers. They help in visualizing the deployment architecture.
- Component Allocation: You can use deployment diagrams to specify which software components are deployed on which nodes or servers. This can be beneficial for understanding the distribution of application logic and services.
- Communication Paths: Deployment diagrams allow you to show communication paths and relationships between components and nodes. You can represent network connections and communication protocols between distributed components.
- Limited Abstraction: Deployment diagrams are primarily concerned with the physical deployment of components. They may not capture all the high-level architectural aspects of a fully distributed system, such as scalability, fault tolerance, or architectural patterns like microservices.
- Complexity: For large and complex fully distributed systems, deployment diagrams can become intricate and challenging to maintain. They may not provide a comprehensive view of the system’s behavior, which is better captured by other UML diagrams like sequence diagrams or component diagrams.
- Abstraction Level: If you need to model the interactions and behavior of distributed components at a higher level, other UML diagrams like sequence diagrams, communication diagrams, or component diagrams may be more suitable.
- Supplementary Documentation: When modeling a fully distributed system, it’s often necessary to accompany deployment diagrams with additional documentation, such as architecture diagrams, system design documents, and network topology diagrams, to provide a more comprehensive understanding of the system.
- Specialized Tools: Using specialized modeling tools that support UML deployment diagrams can help manage the complexity of modeling distributed systems.
UML Deployment Diagrams are valuable for modeling the physical aspects of a distributed system, especially when illustrating the allocation of software components to hardware nodes. However, for modeling the full behavior, interactions, and architectural aspects of a complex and fully distributed system, you may need to complement deployment diagrams with other UML diagrams and extensive documentation to create a more comprehensive representation.
Modeling Distributed Systems
Modeling a distributed system using a deployment diagram is a common practice in software engineering to visually represent the physical architecture and deployment of various components and nodes within a distributed system. Deployment diagrams are part of the Unified Modeling Language (UML) and are particularly useful for planning, designing, and documenting complex distributed systems. Here’s a step-by-step guide on how to create a deployment diagram for a distributed system:
- Identify Components: Begin by identifying the various components and nodes that make up your distributed system. Components can be software applications, databases, hardware devices, servers, or any other relevant entities. List these components and understand their interdependencies.
- Define Nodes: Nodes represent the physical or virtual computing resources where components will be deployed. Nodes can be servers, workstations, cloud instances, or any other hardware or software environment. Identify and name the nodes in your system.
- Allocate Components to Nodes: Determine which components will be deployed on which nodes. You may have multiple instances of the same component running on different nodes for load balancing or redundancy. Connect each component to its corresponding node(s) using deployment connectors.
- Specify Communication Paths: Define the communication paths between components and nodes using communication paths or associations. These paths represent the connections or network links between different parts of your system. Label these paths with information about the type of communication (e.g., HTTP, TCP/IP).
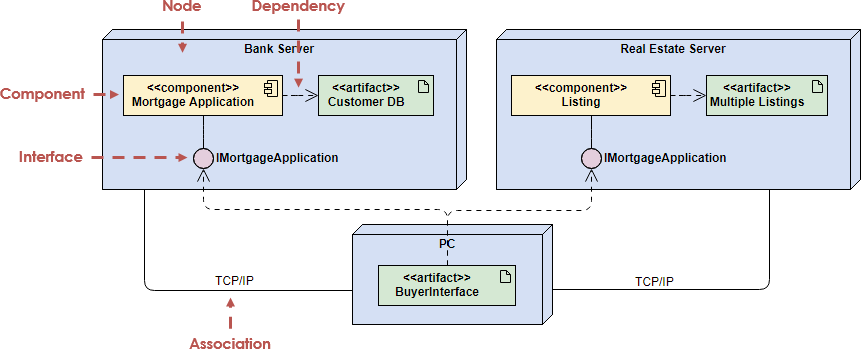
- Add Stereotypes and Artifacts: You can use stereotypes to add additional information to nodes and components, such as specifying whether a node is a physical server or a virtual machine. Artifacts can be added to represent files, libraries, or other resources associated with components.
- Include Interfaces and Ports: If your components have well-defined interfaces and ports, you can represent them in the diagram. Interfaces describe the methods or services that a component offers, while ports represent specific endpoints for communication.
- Label Nodes and Components: Add labels to nodes and components to provide more information, such as the hardware specifications of nodes or the version numbers of software components.
- Consider Deployment Constraints: If your distributed system has specific deployment constraints, such as which nodes can communicate with each other or security requirements, make sure to include these constraints in your diagram.
- Review and Refine: Review your deployment diagram to ensure that it accurately represents the physical architecture of your distributed system. Make any necessary refinements to improve clarity and completeness.
- Documentation: Consider creating accompanying documentation that explains the deployment diagram, including node specifications, component descriptions, communication protocols, and any other relevant information.
Here’s a simplified example of a deployment diagram for a basic web application:
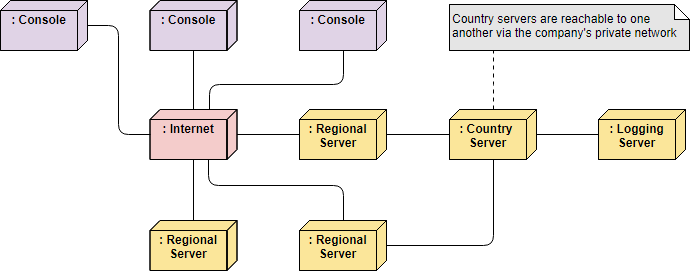
The Figure above depicts the Topology of a fully distributed system which also functions as an object diagram since it exclusively features instances. Within the diagram, three consoles (represented as anonymous instances of the stereotyped node “console”) are visibly connected to the Internet, which is unmistakably depicted as a singleton node. Additionally, three instances of regional servers are present, serving as the front ends for country servers, although only one country server is displayed. As indicated in the accompanying note, country servers are interconnected, but these connections are not represented within this diagram.
Remember that the complexity of your deployment diagram will depend on the complexity of your distributed system. It’s essential to maintain and update the diagram as your system evolves to ensure that it remains an accurate representation of your system’s architecture.
Summary
The provided diagram offers a visual representation of the topology of a fully distributed system. This deployment diagram serves a dual purpose as it exclusively showcases instances, making it an object diagram as well. The diagram prominently displays three consoles, each represented as anonymous instances with the “console” stereotype, all linked to the Internet, which is depicted as a singleton node. Additionally, the diagram features three instances of regional servers that act as front ends for country servers. However, it’s important to note that only one country server is explicitly shown, and the diagram does not illustrate the relationships between the country servers, as clarified in the accompanying note.