


Introduction
In the realm of system analysis and modeling, Data Flow Diagrams (DFDs) serve as powerful tools to unravel the intricacies of information flow and processes within a system. However, the challenge lies in striking the right balance between providing a high-level overview and delving into the granular details. This discussion explores the considerations and best practices in determining the number of levels in DFDs, offering insights into tailoring the diagramming process to the unique needs of each project.
System Decomposition with DFD
1. Context Diagrams:
- Overview: Context diagrams provide a high-level view of the entire system and its interactions with external entities. External entities are sources or destinations of data, representing systems, people, or organizations outside the system.
- Symbols Used:
- Processes (rounded rectangles): Represent the system processes.
- External Entities (squares): Represent sources or destinations of data.
- Data Flows (arrows): Represent the flow of data between processes and external entities.
2. Level 1 Data-Flow Diagrams:
- Overview: Level 1 DFDs provide a more detailed view than context diagrams. They break down the system into major sub-processes and highlight the primary data stores.
- Symbols Used:
- Processes (rounded rectangles): Represent major sub-processes within the system.
- External Entities (squares): Continue to represent sources or destinations of data.
- Data Stores (parallel lines): Represent repositories where data is stored.
- Data Flows (arrows): Show the flow of data between processes, external entities, and data stores.
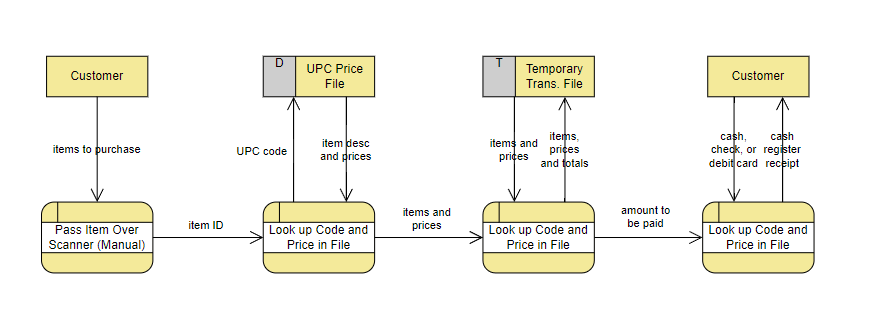
3. Level 2 (and Lower) Data-Flow Diagrams:
- Overview: Through a technique called “levelling,” the detailed complexity of real-world systems is managed by creating a hierarchy of abstractions. Level 2 DFDs and lower levels provide a more granular view of the system, breaking down processes into subprocesses and further detailing data flows and data stores.
- Symbols Used:
- Processes (rounded rectangles): Break down into more detailed subprocesses.
- External Entities (squares): Maintain their role as sources or destinations of data.
- Data Stores (parallel lines): Continue to represent repositories of data.
- Data Flows (arrows): Show detailed paths of data flow between processes, external entities, and data stores.
Creating Data-Flow Diagrams:
- Identify External Entities: Begin by identifying the external entities and their interactions with the system.
- Define Processes: Identify and define the major processes within the system. For context diagrams, these are high-level processes, and for Level 1 and lower, they become more detailed.
- Determine Data Flows: Establish the data flows between processes, external entities, and data stores. Specify what data is input to each process and what data is output.
- Identify Data Stores: Recognize the data stores where information is stored and retrieved.
- Draw Diagrams: Use the appropriate symbols to create the diagrams. Context diagrams focus on high-level interactions, Level 1 diagrams provide more detail, and lower-level diagrams break down processes into finer details.
- Levelling: If needed, apply levelling to manage complexity. Break down processes into subprocesses and create lower-level DFDs.
Factors Influencing the Number of Levels:
- System Complexity: The more complex the system, the more levels may be required to capture the details adequately.
- Project Requirements: The level of detail required by stakeholders and project requirements plays a crucial role. If stakeholders need a granular understanding of processes, more levels may be needed.
- Project Scope: The scope of the project can also determine the number of levels. Large-scale projects or enterprise-level systems may require more levels to capture all the intricacies.
- Clarity vs. Detail Balance: There’s a delicate balance between providing enough detail for analysis and avoiding unnecessary complexity. The number of levels should be sufficient to represent the system accurately without overwhelming stakeholders.
Tips:
- Consistency: Maintain consistency in symbols and notation throughout the diagrams.
- Clarity: Ensure that the diagrams are clear and easy to understand for stakeholders.
Remember, the goal of DFDs is to model system processes and data flow in a way that is comprehensible to both technical and non-technical stakeholders. By following these steps, you can create DFDs that effectively communicate the structure and function of a system.
Best Practices:
- Iterative Approach: Start with a higher-level DFD and iteratively refine it based on feedback and evolving understanding of the system.
- Stakeholder Involvement: Involve stakeholders in the decision-making process regarding the number of levels. Their input can guide the level of detail required for effective communication.
- Documentation: Clearly document the purpose and scope of each level. This helps stakeholders understand what each DFD represents and how it fits into the overall analysis.
Effortless Data Flow Diagram Creation
Unleash the Power of Visual Paradigm’s Online Tool
In the dynamic landscape of software engineering and business information systems, the ability to articulate the movement of data is paramount. Enter Data Flow Diagrams (DFDs), powerful visualizations that illuminate the flow of information within a system. To simplify and expedite the creation of these diagrams, Visual Paradigm offers an online DFD tool that ensures speed, clarity, and professionalism in diagram development. Let’s delve into the features that make Visual Paradigm the ultimate choice for crafting DFDs seamlessly.
Visual Paradigm’s Online Data Flow Diagram Maker emerges as the go-to solution for professionals and enthusiasts alike. This tool facilitates the swift creation of clear and concise DFDs, crucial for understanding data transfer between processes, data stores, and external entities within a business information system.
Whether you’re a seasoned software engineer or a newcomer to DFDs, Visual Paradigm’s tool provides an intuitive platform for drawing and editing DFDs effortlessly. With a rich array of examples to draw inspiration from, this tool ensures that your DFDs are not only informative but also visually appealing. Make the smart choice — embrace Visual Paradigm’s Online Data Flow Diagram Maker for a seamless and professional diagramming experience.
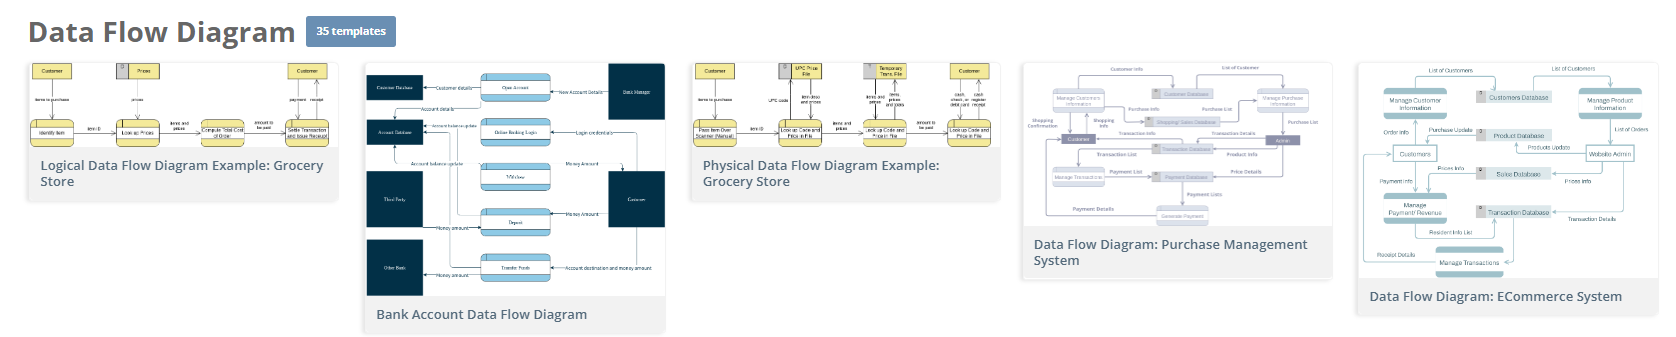
Data Flow Diagram Templates
Jumpstart your design with professional data flow diagram templates
Summary
Deciding how many levels of DFDs to incorporate is a nuanced process influenced by factors such as system complexity, project requirements, and stakeholder needs. The journey typically starts with a Context Diagram (Level 0), providing a bird’s-eye view of the system’s interactions.
As the complexity of the system dictates, Level 1 DFDs offer a more detailed breakdown. The iterative approach and stakeholder involvement play pivotal roles in refining the number of levels, ensuring that each level strikes the right balance between clarity and detail. Ultimately, the goal is to create a comprehensive set of DFDs that effectively communicates the system’s architecture without overwhelming stakeholders.