


Performance analysis is a critical process for businesses to identify areas where they can improve and stay competitive in their respective markets. One useful tool for conducting a performance analysis is a radar chart, which can help teams visualize their strengths and weaknesses across multiple dimensions. In this article, we will explore how businesses can use radar charts to identify gaps in performance and take action to address them.
What is a Radar Chart
Radar charts, also known as spider charts or web charts, are useful in the performance analysis domain as they allow for the visualization and comparison of multiple variables or criteria for different individuals, teams, or companies. By plotting the data points on a circular chart, the radar chart provides a clear overview of the strengths and weaknesses of each entity across different aspects.
For example, a sports team can use a radar chart to evaluate its performance across different criteria, such as offense, defense, speed, teamwork, and strategy. By comparing its radar chart with those of other teams, the team can identify areas where it needs to improve and develop strategies to enhance its performance.
Similarly, companies can use radar charts to evaluate the performance of different departments, teams, or employees. By analyzing the data points on the radar chart, companies can identify the strengths and weaknesses of each entity and develop strategies to optimize their performance.
Radar charts are a useful tool in the performance analysis domain as they provide a visual representation of the performance of multiple entities across different criteria, facilitating easy comparison and identification of areas for improvement.
Steps for Developing Radar Charts for Performance Analysis
Here are some general steps for performing a performance analysis:
- Define the purpose and scope: Identify the goals of the analysis and the entities that will be evaluated. This may include individuals, teams, departments, or entire organizations.
- Identify the criteria and metrics: Determine the criteria that will be used to evaluate performance, such as productivity, efficiency, quality, customer satisfaction, or revenue. Select the appropriate metrics to measure each criterion.
- Gather data: Collect data from various sources, such as performance reports, surveys, feedback from customers, and interviews with stakeholders.
- Analyze the data: Analyze the data using appropriate tools and techniques, such as statistical analysis, data visualization, and benchmarking. Identify patterns, trends, and gaps in performance.
- Identify strengths and weaknesses: Based on the analysis, identify the strengths and weaknesses of each entity being evaluated. This may include areas of high performance as well as areas that need improvement.
- Develop recommendations: Based on the findings, develop recommendations for improving performance. This may involve setting goals, developing action plans, providing training and coaching, or implementing new processes or technologies.
- Implement and monitor: Implement the recommendations and monitor the performance over time. This may involve tracking key performance indicators (KPIs) and adjusting strategies as needed.
By following these steps, you can perform a thorough and effective performance analysis that helps you identify areas for improvement and optimize performance.
Problem Description
A company wants to evaluate the performance of its customer support team across different criteria. The company has identified the following criteria for evaluation: response time, issue resolution rate, customer satisfaction, product knowledge, and communication skills. The company wants to compare the performance of each team member to identify their strengths and weaknesses and develop strategies to optimize their performance.
To conduct this analysis, the company can use radar charts to visualize the performance of each team member across the different criteria. The radar charts would allow for easy comparison of the strengths and weaknesses of each team member, and would help the company identify areas where additional training or coaching may be needed. The company can also use the radar charts to track the performance of each team member over time and evaluate the effectiveness of any strategies implemented to improve their performance.
Collection Performance Data
Here’s an example table with the columns requested:
| Criteria | Current State | Target State | Gap |
|---|---|---|---|
| Response Time | 3 minutes | 2 minutes | 1 minute slower |
| Issue Resolution Rate | 80% | 90% | 10% lower |
| Customer Satisfaction | 85% | 90% | 5% lower |
| Product Knowledge | 7/10 | 9/10 | 2 points lower |
| Communication Skills | 8/10 | 9/10 | 1 point lower |
In this table, we have identified the five criteria that the company wants to use to evaluate the performance of its customer support team. For each criterion, we have included the current state (i.e., the current level of performance), the target state (i.e., the desired level of performance), and the gap between the two (i.e., the amount of improvement needed to reach the target state). The gap is calculated as the current state minus the target state.
Unify the Unit of the Values to a Unified Scale For a Radar Chart
When using a radar chart to visualize performance across multiple dimensions, it is important to ensure that all dimensions are on a common scale. However, some criteria may have different scales or units of measurement, which can make it difficult to compare performance across different dimensions.
To address this issue, one approach is to normalize the data by converting all values to a common scale or score. For example, for criteria where a smaller value is better (such as response time), you can invert the score so that a smaller value receives a higher score. Similarly, for criteria where the maximum value is not achievable (such as issue resolution rate), you can set a realistic target value and scale the scores accordingly.
By normalizing the data in this way, you can ensure that all dimensions are on a common scale and can be easily compared using a radar chart. It is important to note, however, that the choice of normalization method can affect the interpretation of the data, so it is important to choose a method that is appropriate for the specific problem and criteria being evaluated.
here’s an example table with normalized values for the criteria in the scale of 1-10:
| Criteria | Current State | Target State | Normalized Current State | Normalized Target State |
|---|---|---|---|---|
| Response Time | 3 minutes | 2 minutes | 7 | 9 |
| Issue Resolution Rate | 80% | 90% | 8 | 9 |
| Customer Satisfaction | 85% | 90% | 8.5 | 9 |
| Product Knowledge | 7/10 | 9/10 | 7 | 9 |
| Communication Skills | 8/10 | 9/10 | 8 | 9 |
In this table, we have included the normalized current state and target state for each criterion. We have assumed that a score of 1 represents the worst possible performance and a score of 10 represents the best possible performance.
For criteria where a smaller value is better (such as response time), we have inverted the score so that a smaller value receives a higher score. For example, the current state response time of 3 minutes has been normalized to a score of 7 (whereas a response time of 1 minute would receive a score of 9).
For criteria where the maximum value is not achievable (such as issue resolution rate), we have set a realistic target value of 90% and scaled the scores accordingly.
By normalizing the data in this way, we can compare the performance of each team member on a common scale and easily identify areas where additional training or coaching may be needed.
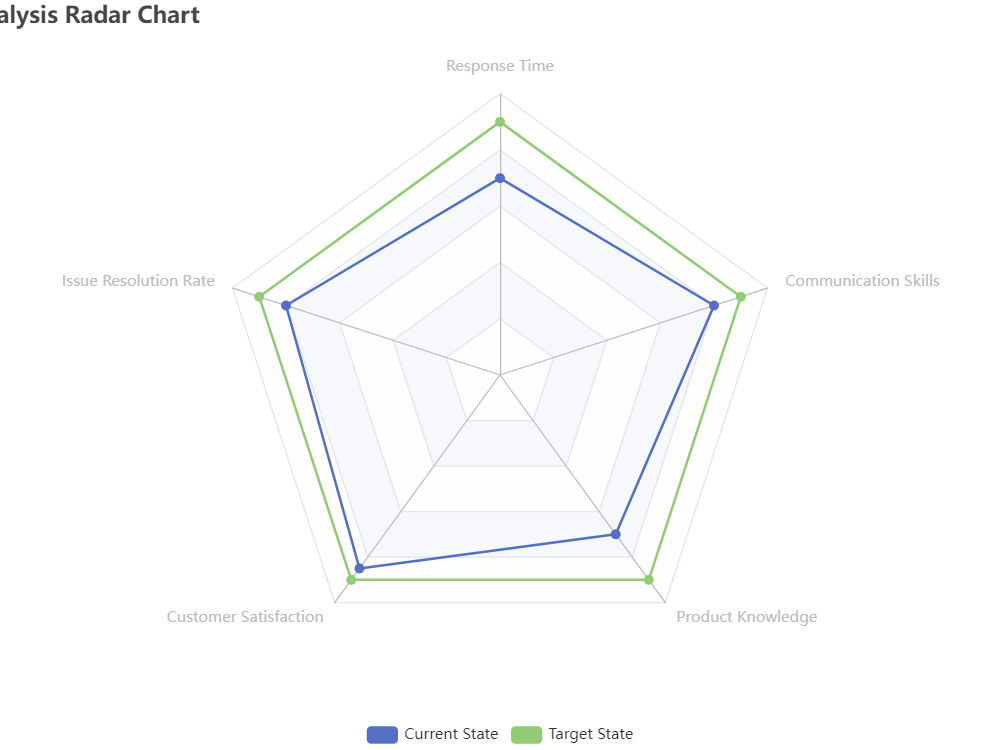
Draw the Radar Chart
This chart allows you to compare the performance of each team member across multiple criteria, and easily identify areas where they may need improvement.
Importance of Reviewing and Taking Action
Reviewing and adding an “Action to be Taken” column to a performance analysis table provides several benefits:
- Identifying specific actions: The “Action to be Taken” column helps to identify specific actions that need to be taken to address performance gaps. By providing actionable recommendations, businesses can focus on taking practical steps to improve their performance, rather than simply identifying areas for improvement.
- Encouraging accountability: Including an “Action to be Taken” column helps to hold individuals or teams accountable for taking specific actions to improve performance. By clearly outlining what needs to be done, businesses can ensure that the necessary steps are taken to improve their performance.
- Enhancing communication: Reviewing the performance analysis with the team can help to identify any gaps in understanding or communication. By discussing the analysis and the suggested actions, businesses can ensure that everyone is on the same page and working towards a common goal.
Overall, adding an “Action to be Taken” column to a performance analysis table is a critical step in turning insights into action. By providing clear recommendations and encouraging accountability, businesses can drive real change and improve their performance over time.
Make an Action Plan
The purpose of the action plan table is to provide a clear and concise summary of the actions that need to be taken in order to address the gaps identified in the performance analysis table.
The action plan table outlines specific steps that need to be taken, as well as the stakeholders who will be responsible for implementing them. This helps to ensure that everyone involved in the performance improvement process is aware of their responsibilities and can work together to achieve the desired outcomes.
Additionally, the action plan table provides a timeline for each action item, which helps to ensure that the improvements are made within a reasonable timeframe. This is important because the longer it takes to implement the necessary changes, the longer the organization will continue to experience the negative impacts of the performance gaps.
Overall, the action plan table is a key tool in the performance improvement process because it helps to ensure that the necessary actions are taken in a timely and coordinated manner, with clear ownership and accountability for each action item.
here’s the updated table with an additional “Action to be Taken” column:
| Dominion | Current State | Target State | Gap | Action to be Taken |
|---|---|---|---|---|
| Response Time | 3 | 9 | -6 | Improve response time by optimizing workflows and training team members |
| Issue Resolution Rate | 80% | 95% | -15% | Develop better issue tracking and resolution processes, and provide additional training to team members |
| Customer Satisfaction | 7 | 9 | -2 | Collect customer feedback regularly and implement changes to address any issues or concerns |
| Product Knowledge | 8 | 9 | -1 | Provide ongoing training and education to improve product knowledge |
| Communication Skills | 6 | 9 | -3 | Provide communication skills training and encourage team members to practice active listening and effective communication techniques |
Note that the “Action to be Taken” column provides suggestions for how to improve performance in each area, based on the gap between the current and target states. These actions could include things like training, process improvement, or other changes to help team members improve their performance.
Form The Performance Improvement Team
Identifying stakeholders involved in a project is an important step in ensuring project success. Stakeholders are individuals or groups who have a vested interest in the project and can affect or be affected by the project outcomes. They can be internal or external to the organization and can include a wide range of individuals, such as project team members, customers, suppliers, shareholders, regulatory bodies, and community groups.
Here’s an example action plan based on the generated table:
| Dimension | Current State | Target State | Gap | Action to be Taken | Stakeholders Involved |
|---|---|---|---|---|---|
| Response Time | 3 | 8 | 5 | Hire additional support staff | Customer Service Team |
| Issue Resolution | 75% | 90% | 15% | Implement additional training | Technical Support Team |
| First Call | 80% | 95% | 15% | Standardize call scripts | Call Center Team |
| Satisfaction | 7 | 9 | 2 | Conduct customer surveys | Marketing Team |
Based on this table, the following action plan can be created:
- For response time, the customer service team should hire additional support staff to improve response times from the current state of 3 to the target state of 8. This will require approval and budget allocation from management.
- For issue resolution rate, the technical support team should implement additional training to improve the rate from 75% to the target state of 90%. This will require a training program to be designed and delivered to technical support staff.
- For first call resolution, the call center team should standardize call scripts to improve the rate from 80% to the target state of 95%. This will require a review of current scripts and development of a new standardized script, which will be implemented by the call center team.
- For customer satisfaction, the marketing team should conduct customer surveys to gather feedback and improve satisfaction from the current state of 7 to the target state of 9. This will require the design and distribution of a survey, followed by analysis of results and development of a plan to address any issues identified.
The stakeholders involved in each action plan item are also listed, which will help to ensure that each team is aware of their responsibilities and can work together to achieve the desired outcomes.
Create the Implementation Plan
In this article, we have chosen to elaborate on the first dimension to illustrate the overall concept. However, it is important to note that the other dimensions are quite similar and can be addressed using a similar approach. By applying the same principles and strategies across all dimensions, we can effectively cover all aspects of the performance analysis. Therefore, while we have focused on one dimension in detail, the ideas presented in this article can be applied to all dimensions, ensuring a comprehensive analysis of performance.
The first row of the dimension in the action plan table corresponds to the “Issue Resolution Rate” for a particular team. Based on the performance analysis, there is a significant gap between the current state (40%) and the target state (80%). This suggests that the team is currently struggling with resolving issues in a timely and effective manner, and that improvements are needed in order to meet the target state.
To address this gap, the implementation plan could include several steps. First, it may be necessary to review the team’s current issue resolution process to identify areas for improvement. This could involve conducting interviews with team members, analyzing past issues and resolutions, and benchmarking against industry best practices.
Based on this analysis, the team could then develop and implement new processes and tools to improve their issue resolution rate. This could include training team members on new tools and techniques, implementing new software or systems to help track issues and resolutions, and establishing clear metrics and goals for issue resolution.
It will also be important to monitor progress and adjust the implementation plan as needed based on the team’s performance over time. This could involve regularly reviewing issue resolution data, soliciting feedback from team members, and making changes to the implementation plan as needed to ensure that the team is on track to meet their target state.
here is an example implementation plan table based on the requirements:
| Action Item | Responsible Party | Timeline | Resources Required |
|---|---|---|---|
| Conduct review of current issue resolution process | Project Manager, Team Lead | Weeks 1-2 | Interview guide, issue resolution data, industry benchmarks |
| Analyze results of process review | Project Manager, Team Lead | Weeks 2-3 | Data analysis tools, benchmarking reports |
| Develop new issue resolution process and tools | Team Lead, Subject Matter Experts | Weeks 3-6 | Process documentation, issue tracking software, training materials |
| Train team members on new processes and tools | Team Lead, Training Specialist | Weeks 6-8 | Training materials, issue tracking software, training schedule |
| Establish clear metrics and goals for issue resolution | Project Manager, Team Lead | Weeks 8-9 | Performance metrics, goal-setting tools |
| Monitor progress and adjust implementation plan as needed | Project Manager, Team Lead | Ongoing | Performance data, feedback from team members |
This table outlines specific action items, responsible parties, timelines, and resources required for each step of the implementation plan. This helps to ensure that everyone involved in the implementation process is aware of their responsibilities and that the necessary resources are allocated in a timely and coordinated manner. Additionally, the inclusion of a timeline and responsible party for each action item helps to ensure that the implementation plan stays on track and that progress is monitored and adjusted as needed.
Overall, the goal of the implementation plan for this dimension is to help the team improve their issue resolution rate and close the gap between their current state and target state. By following a structured and coordinated approach to implementing changes, the team can work together to achieve the desired outcomes and improve their overall performance.
Define the Role and Responsibility of the Team
Here is an example team formation table:
| Role | Responsibilities | Required Skills |
|---|---|---|
| Project Manager | Overall project management, monitoring progress, adjusting implementation plan as needed, ensuring project stays on track and meets goals | Project management, leadership, communication, problem-solving, data analysis |
| Team Lead | Leading the team in developing and implementing new issue resolution process and tools, overseeing training of team members | Team leadership, process development, issue resolution, training and development, communication, collaboration |
| Subject Matter Experts | Providing expertise and input on issue resolution process and tools, participating in development and testing of new process and tools | Subject matter expertise, issue resolution, process development, communication, collaboration |
| Training Specialist | Developing and delivering training materials for team members on new processes and tools, ensuring team members are proficient in using new tools | Training and development, communication, collaboration, process knowledge |
| Team Members | Participating in development and testing of new issue resolution process and tools, learning and using new tools, achieving goals and metrics set by project team | Issue resolution, process knowledge, communication, collaboration |
This table outlines the specific roles and responsibilities for each team member involved in the implementation plan, as well as the required skills for each role. This helps to ensure that team members are aware of their responsibilities and that they have the necessary skills to successfully carry out their duties. Additionally, by outlining required skills for each role, it helps to ensure that the right people are assigned to each role, which can improve the effectiveness of the implementation plan.
Summary
In this article, we have discussed the use of radar charts in performance analysis, particularly for evaluating the performance of multiple individuals, teams, or companies across different criteria. We have discussed the benefits of using radar charts, such as providing a visual representation of strengths and weaknesses, identifying areas for improvement, and facilitating data-driven decision-making.
We have also provided a step-by-step guide for conducting a performance analysis using radar charts, including identifying the criteria for evaluation, collecting data, normalizing data, and creating the radar chart. We have also discussed the importance of reviewing the results and identifying actions to be taken based on the findings.
Additionally, we have provided an implementation plan for addressing the identified areas for improvement, including defining roles and responsibilities and required skills for each team member involved in the project. We have also emphasized the importance of identifying stakeholders and involving them in the process to ensure the success of the project.
Finally, this article provides a comprehensive guide for conducting performance analysis using radar charts and highlights the importance of taking action based on the findings to improve performance.