Introduction
Understanding the intricate web of relationships and interactions within a software system is a crucial step in its development. One powerful tool that aids in this process is the context diagram, also known as a level 0 data-flow diagram. This visual representation serves as the cornerstone in defining the boundaries and context of the system under consideration. In this article, we delve into the significance of context diagrams and the step-by-step process of constructing one.
What is a Context Diagram? A context diagram is a graphical illustration that elucidates the relationships between a system and its external entities. Its primary goal is to establish a clear boundary between what is inside and outside the system being modeled. This tool is particularly useful in identifying the flow of information between the system and external entities. Often depicted as a single-process diagram, the context diagram provides a high-level overview of the entire software system.
Example Context Diagram
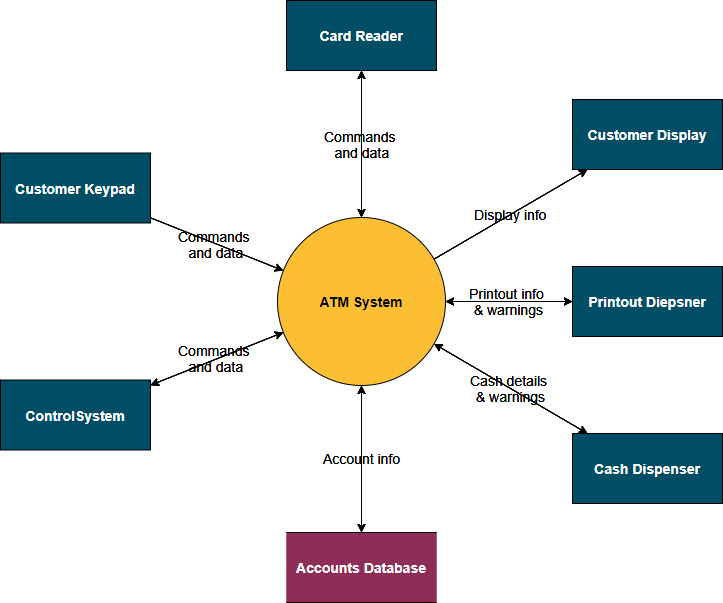
Significance of a Context Diagram
The construction of a context diagram initiates the process of establishing an analysis framework. This involves engaging in discussions with users to understand existing system issues and gather specific requirements for the new system. These discussions lead to the formal documentation of requirements, paving the way for a comprehensive understanding of the system’s scope.
Constructing a Context Diagram in 5 Steps
Steps in Constructing a Context Diagram
- Identify Data-Flows: Begin by listing major documents and information flows associated with the system. This includes forms, documents, reference materials, and both structured and unstructured information such as emails and telephone conversations. These data-flows form the backbone of the context diagram.
- Identify External Entities: Determine sources and recipients of the identified data-flows that lie outside the system under investigation. External entities can include actors in any use case models previously created. Recognizing these entities is crucial to understanding the system’s relationships with its environment.
- Draw and Label the System Process: Create a process box that represents the entire system. This box encapsulates the system as a single, cohesive entity.
- Draw and Label External Entities: Position external entities around the outside of the process box. Clearly label each external entity to maintain clarity in the diagram.
- Add Data-Flows: Connect external entities to the system process box with data-flows. Focus on the information exchange between the system and external entities. Internal flows within the system can be temporarily ignored at this stage.
What Next?
The context diagram, often referred to as the Level-0 DFD, provides a bird’s-eye view of the entire system, representing it as a single process. As you move to lower levels, each major process in the context diagram is decomposed into more detailed processes, leading to the creation of Level-1 DFDs, Level-2 DFDs, and so forth.
This decomposition or leveling process serves several purposes:
- Increased Detail: As you move to lower levels, each DFD provides a more detailed breakdown of the processes and their interactions. This is crucial for understanding the intricacies of the system’s functionality.
- Modularization: Breaking down the system into smaller, manageable processes makes it easier to understand and analyze. It also facilitates a modular approach to system development, where each subprocess can be tackled independently.
- Clarity and Communication: Lower-level DFDs enhance clarity by focusing on specific aspects of the system. This facilitates effective communication between analysts, designers, and stakeholders, as they can delve into specific parts of the system as needed.
- Step-by-Step Analysis: The hierarchical structure allows for a step-by-step analysis of the system. Starting from the top-level context diagram, you can progressively explore and understand the system in greater detail, making the analysis more manageable.
- Progressive Refinement: Each level of decomposition represents a stage of progressive refinement. This iterative process ensures that the representation becomes more detailed and accurate as you move through the levels.
- Identification of Processes: Through this decomposition, you identify and label specific processes, data stores, data flows, and external entities, making it easier to allocate responsibilities and understand the flow of information.
- Scalability: The hierarchical structure makes the DFD scalable. It can adapt to projects of varying sizes and complexities, providing a framework for both high-level and detailed analyses.
Remembering this hierarchy, from the context diagram as Level-0 to subsequent levels as Level-1, Level-2, and so on, is fundamental in creating a systematic and organized representation of a system’s functionality. It’s a journey from the macro to the micro, offering a comprehensive and structured approach to systems analysis and design.
Discussion and Agreement
Once the context diagram is constructed, it becomes a focal point for discussions with stakeholders. The system boundary and details depicted in the diagram are refined through consultation until a consensus is reached. This agreement sets the stage for defining the system’s scope and planning detailed investigations into specific areas.
Tips and Tricks for Clear System Understanding
- Understand the System’s Purpose: Before diving into the creation of a context diagram, ensure a clear understanding of the system’s purpose and objectives. This foundational knowledge will guide the identification of external entities and data-flows.
- Engage Stakeholders: Collaborate with stakeholders, including end-users and clients, to gather insights into existing system issues and requirements. Stakeholder input is invaluable for accurately defining the system’s context.
- Identify Major Data-Flows: List and prioritize major documents, information flows, and communication channels associated with the system. This comprehensive list serves as a basis for constructing data-flows in the context diagram.
- Spot External Entities: Identify external entities by recognizing sources and recipients of data-flows lying outside the system. This can include actors from use case models and any external entities crucial to the system’s functioning.
- Use Consistent Labeling: Maintain clarity in your context diagram by using consistent and clear labeling for both the system process box and external entities. Clear labels enhance understanding and ease of communication with stakeholders.
- Keep it High-Level: Remember that a context diagram is a high-level representation. Focus on illustrating the macroscopic relationships between the system and external entities, avoiding unnecessary details that can be addressed in later diagrams.
- Prioritize External Communication: Emphasize the data-flows and interactions between the system and external entities. This is the primary focus of the context diagram and should be represented with clarity.
- Review and Iterate: Periodically review your context diagram with stakeholders. Be open to feedback and iterate on the diagram as needed. This collaborative approach ensures that the final representation accurately reflects the system’s context.
- Consider Future Expansions: Anticipate potential changes and future expansions of the system. While the context diagram represents the current state, it should be flexible enough to accommodate future modifications without significant overhauls.
- Use Diagramming Tools: Leverage diagramming tools to create a professional and visually appealing context diagram. These tools often provide features for easy adjustments, annotations, and collaborative editing, streamlining the diagram creation process.
- Document Assumptions and Constraints: Clearly document any assumptions or constraints that impact the context diagram. This transparency ensures that stakeholders are aware of the context’s limitations and the underlying assumptions made during its creation.
- Seek Validation: Validate the context diagram with stakeholders to confirm that it accurately represents their understanding of the system’s boundaries and relationships. This step ensures alignment and minimizes misunderstandings.
By incorporating these tips and tricks, you can enhance the effectiveness of your context diagram creation process, fostering a clearer understanding of system context among all stakeholders involved.
Recommended Tools
While Visual Paradigm is a robust and feature-rich diagramming tool that supports Data Flow Diagrams (DFDs), it’s important to note that the “ultimate choice” depends on various factors, including personal preferences, project requirements, and team dynamics. Visual Paradigm is known for its user-friendly interface, collaboration features, and support for different diagram types, making it a solid choice for many professionals.
Here are a few reasons why Visual Paradigm could be considered an excellent choice for creating DFDs:
- Intuitive Interface: Visual Paradigm provides an intuitive and user-friendly interface that simplifies the process of creating complex diagrams, including DFDs. The drag-and-drop functionality and a wide range of pre-built shapes make diagram creation efficient.
- Collaboration Features: Collaboration is a key aspect of many projects, and Visual Paradigm offers collaboration features that allow team members to work together in real-time. This is particularly useful for projects where multiple stakeholders are involved in creating or reviewing DFDs.
- Variety of Diagrams: Visual Paradigm supports a wide range of diagram types, not just DFDs. This versatility can be beneficial if your project involves creating various types of diagrams to communicate different aspects of the system.
- Advanced Features: The tool comes equipped with advanced features such as version control, diagram validation, and integration with other project management tools. These features contribute to a more streamlined and organized diagramming process.
- Template Support: Visual Paradigm provides templates for different diagram types, including DFDs. This can be a time-saving feature, especially when you need to create standard diagrams consistently across projects.
However, it’s essential to consider factors such as your team’s familiarity with the tool, the specific requirements of your project, and any budget constraints. Other popular diagramming tools, such as Draw.io, and Microsoft Visio, also offer strong support for DFDs and may align better with your team’s preferences and needs.
Ultimately, the “ultimate choice” varies based on individual and team preferences. It’s advisable to explore the features of different diagramming tools, consider user reviews, and perhaps even try out a few to determine which one best suits your specific requirements and workflow.
Conclusion
In the realm of software development, context diagrams stand as invaluable tools in unraveling the complexities of system boundaries and relationships. Through a systematic approach to construction, involving the identification of data-flows and external entities, these diagrams pave the way for meaningful discussions and consensus-building among stakeholders. Embracing the power of context diagrams is a foundational step toward building robust and well-defined software systems.
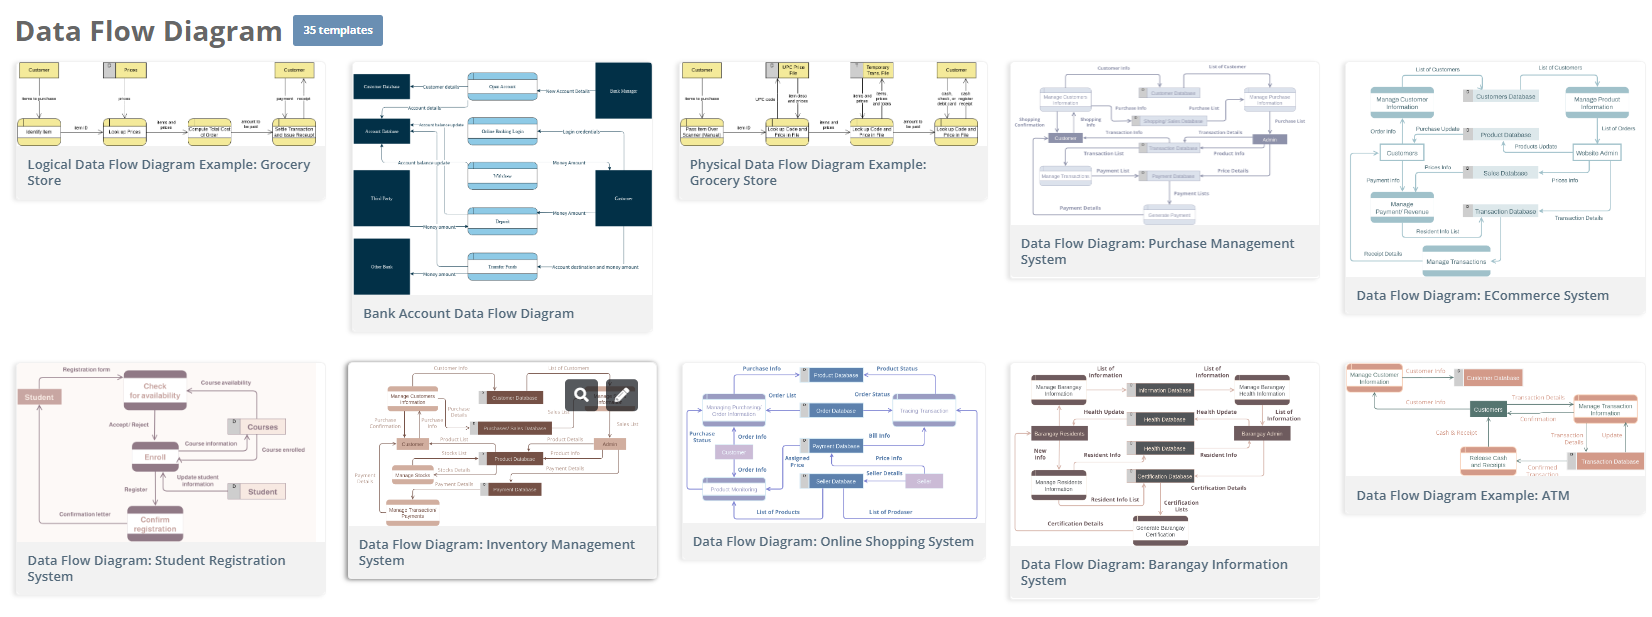
Data Flow Diagram Templates
Jumpstart your design with professional data flow diagram templates