Introduction
Navigating the intricate landscape of software engineering demands tools that can distill complexity into clarity. Among these tools, Data Flow Diagrams (DFDs) stand as pillars, offering a visual roadmap for understanding the flow of information within a system. In this comprehensive guide, we will embark on a journey through the fundamentals, principles, and structured levels of DFDs to empower you with the skills needed to wield this indispensable instrument in software design.
Unveiling the Essence of DFDs
At its core, a Data Flow Diagram is a graphical representation that captures the movement and transformation of data within a system. Whether the system is manual, automated, or a blend of both, a well-crafted DFD serves as a compass, guiding stakeholders through the intricacies of system requirements.
Primary Objectives of a DFD:
- Scope Definition: Clearly delineate the boundaries and scope of the system.
- Communication Tool: Facilitate effective communication between system analysts and stakeholders.
- Redesign Launchpad: Act as a starting point for system redesign and improvement.
Guiding Principles for Effective DFDs
To harness the full potential of DFDs, it’s crucial to adhere to key principles:
- Unique Naming: Ensure all elements in the DFD have distinct names, fostering clarity and precision in references.
- Differentiation from Flow Charts: Unlike flow charts that depict the sequence of events, DFDs focus on data flow. Arrows signify the movement of data, not the order of operations.
- Avoidance of Logical Decisions: Eschew the use of diamond-shaped decision points found in flow charts, as DFDs do not prescribe an explicit order of events.
- Deferred Details: Postpone intricate details, such as error conditions and handling, until later stages of analysis to prevent drowning in minutiae.
Standard Symbols in DFDs
Derived from electric circuit diagram analysis, DFDs employ standardized symbols:
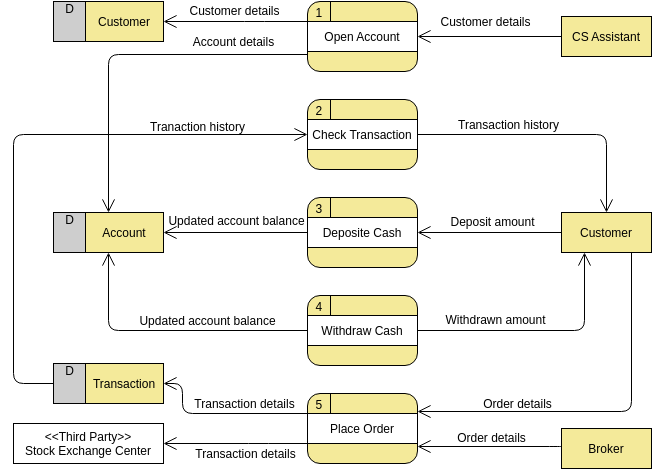
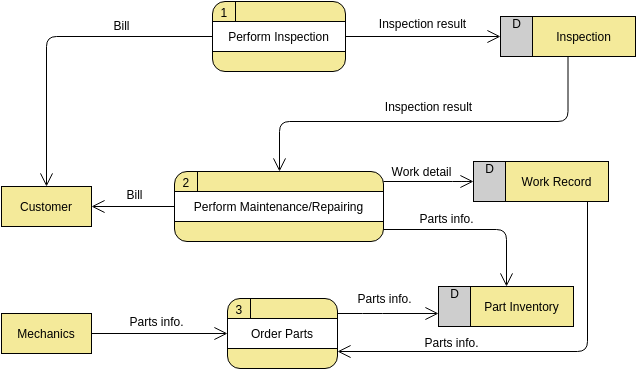
- Circle (Bubble): Represents a process that transforms data inputs into outputs.
- Curved Line (Data Flow): Indicates the movement of data into or out of a process or data store.
- Parallel Lines (Data Store): Designates a location for storing data, accessible for future use by other processes.
- Source or Sink: External entities serving as sources of inputs or destinations for outputs.
Levels in DFDs: Structuring Complexity
DFDs are organized into levels, each contributing to a progressively detailed understanding of the system:
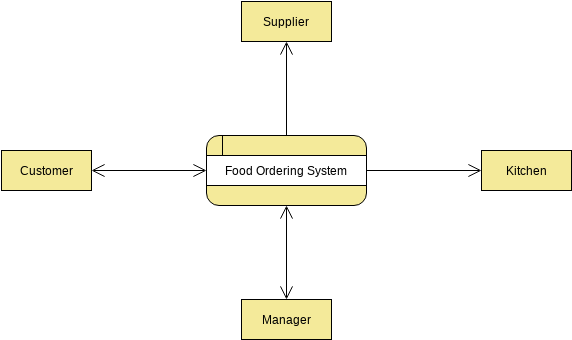
- 0-level DFD (Fundamental System Model):
- Depicts the entire software requirement within a single bubble, showcasing input and output data.
- Acts as the foundation for further decomposition into more detailed DFDs.

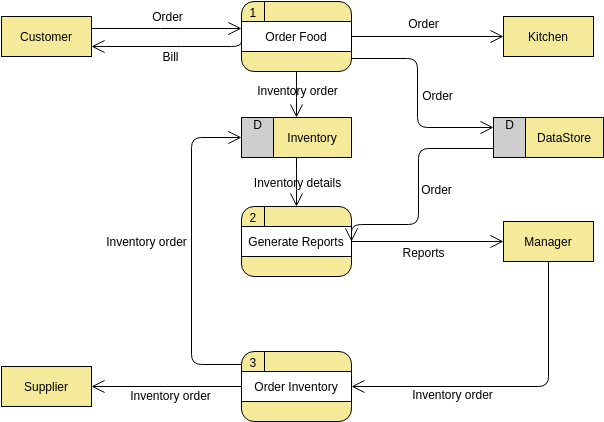
- 1-level DFD:
- Breaks down the context diagram into multiple processes, emphasizing the primary objectives and subprocesses of the system.
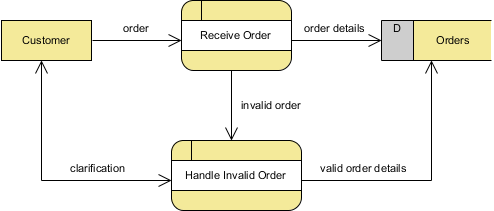
- 2-level DFD:
- Delves deeper, offering a granular view of the system’s functioning.
- Records specific details necessary for a comprehensive understanding.
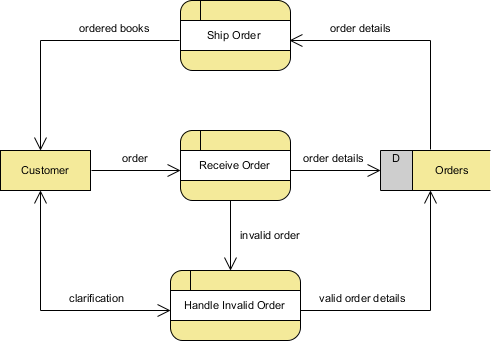
Conclusion: Empowering Software Engineering
As you embark on the journey of software engineering, consider Data Flow Diagrams as your trusty companions. Beyond being visual aids, they are powerful tools for communication, analysis, and redesign. Armed with the principles and symbols outlined in this guide, you possess the key to unraveling the intricate dance of data within a system. Let DFDs be your guiding light in the expansive realm of software design and engineering.
Explore the Power of Online DFD Creation with Visual Paradigm
Unlock the potential of seamless Data Flow Diagram (DFD) creation with Visual Paradigm’s online DFD software. As an integral tool in software engineering, DFDs visually represent the intricate movement of data within a business information system. Now, drawing professional-grade DFDs is at your fingertips, thanks to Visual Paradigm’s intuitive online platform.
Why Choose Visual Paradigm for DFD Creation?
- Effortless Online Drawing:
- Access the power of DFD creation anytime, anywhere with Visual Paradigm’s online platform.
- Intuitive interface ensures a smooth and efficient drawing experience.
- Comprehensive Data Visualization:
- Visualize the seamless transfer of data between processes, data stores, and external entities.
- Gain a holistic view of your business information system’s data flow dynamics.
- Years of Software Engineering Expertise:
- Leverage a tool crafted by experts in software engineering.
- Align your DFDs with industry best practices effortlessly.
- Professional-Grade Results:
- Create DFDs that are not only informative but also polished and professional.
- Impress stakeholders and colleagues with visually compelling diagrams.
Drawing Inspiration Made Easy
Need a creative spark to kickstart your DFD creation? Visual Paradigm offers a gallery of inspiring Data Flow Diagram examples. Click on a diagram to view it in detail, or hit the edit button to dive straight into customization. These examples serve as springboards for your creativity, providing practical insights into various DFD applications.
How to Get Started:
- Visit Visual Paradigm’s Online Platform:
- Access the online DFD software on Visual Paradigm’s website.
- Explore DFD Examples:
- Browse through a collection of DFD examples for inspiration.
- Click and Edit:
- Click on a diagram to view it, or hit the edit button to start your own creation.
- Craft Your DFD:
- Utilize the intuitive drawing tools to craft a DFD that aligns with your system’s intricacies.
- Save and Share:
- Save your work online and effortlessly share it with your team or stakeholders.
Visual Paradigm’s online DFD software empowers you to transform your data flow concepts into visually captivating diagrams. Experience the synergy of intuitive design and powerful functionality to elevate your DFD creation process. Unleash the potential of online DFD drawing with Visual Paradigm today.
Learn by Examples
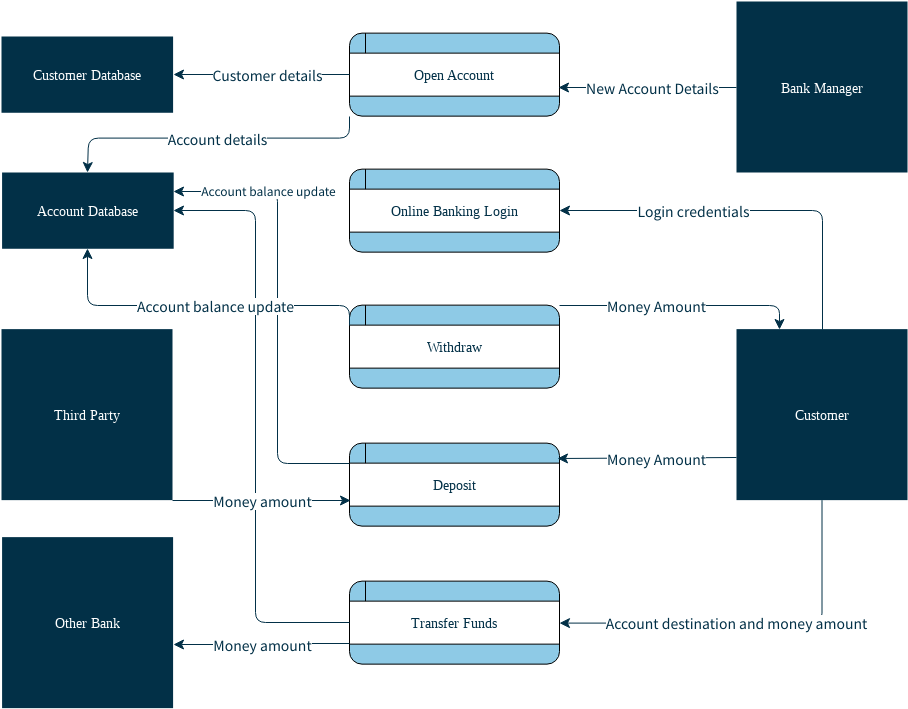
Bank Account Data Flow Diagram

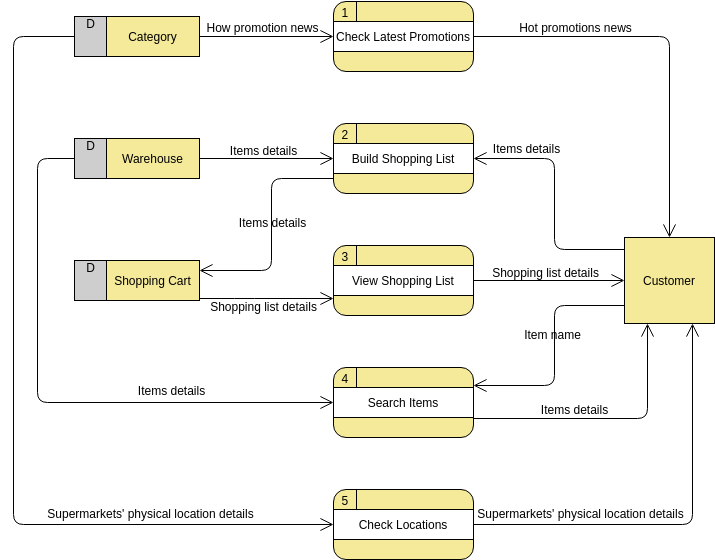
Physical Data Flow Diagram Example: Grocery Store
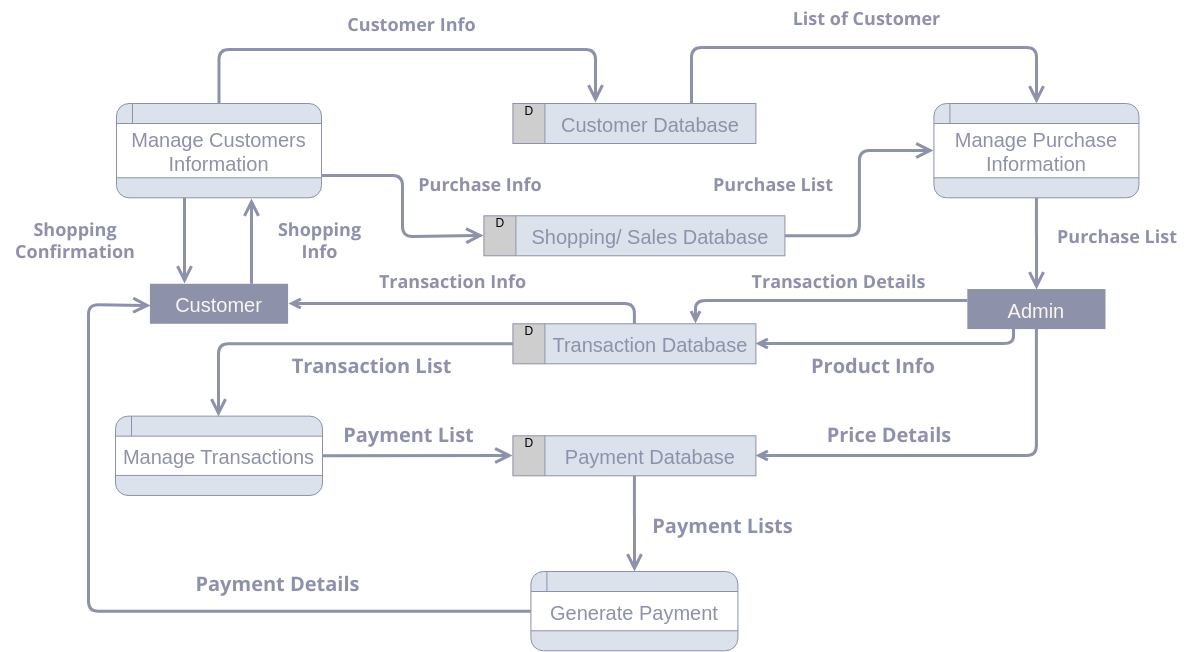
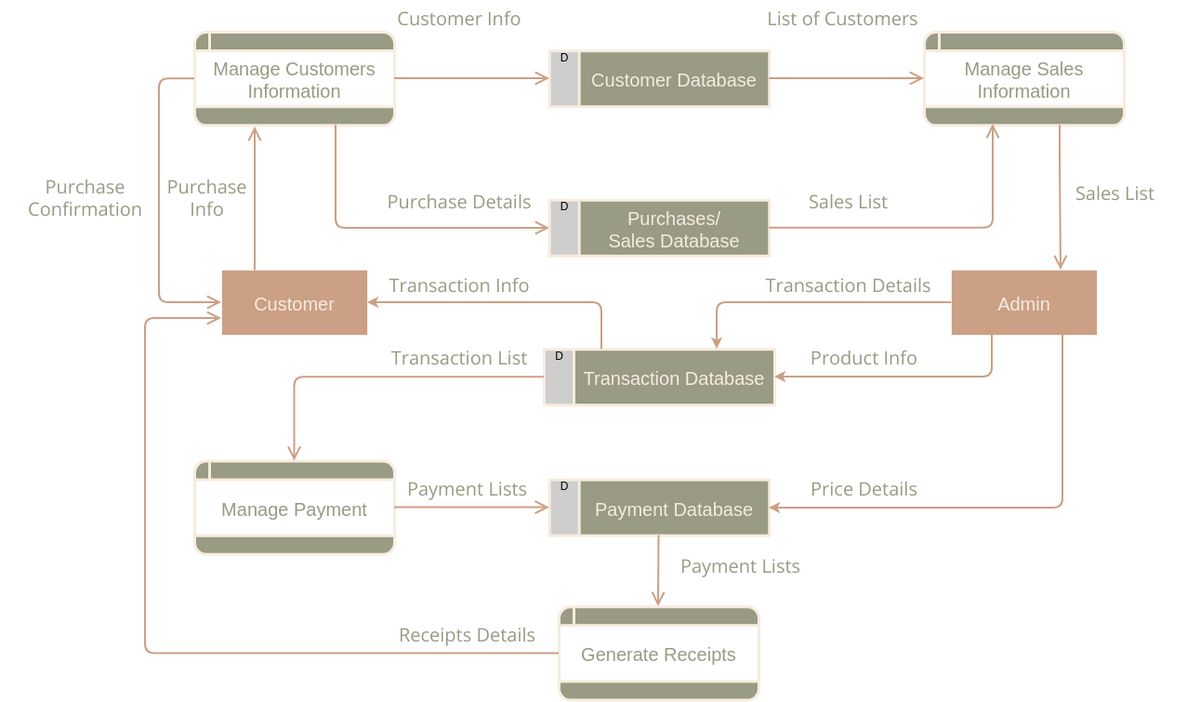
Data Flow Diagram: Purchase Management System
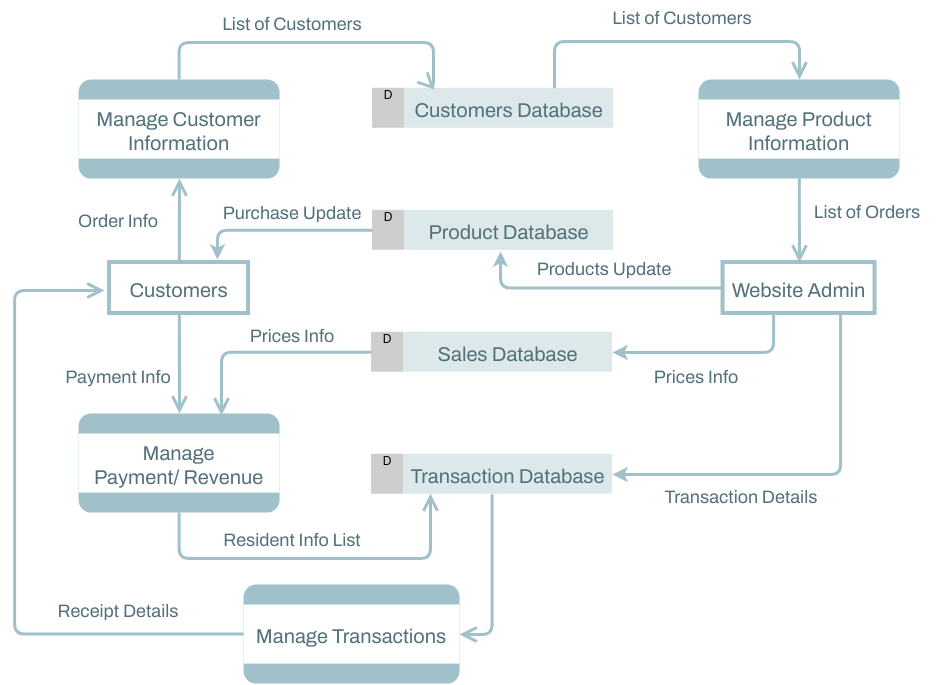
Data Flow Diagram: ECommerce System
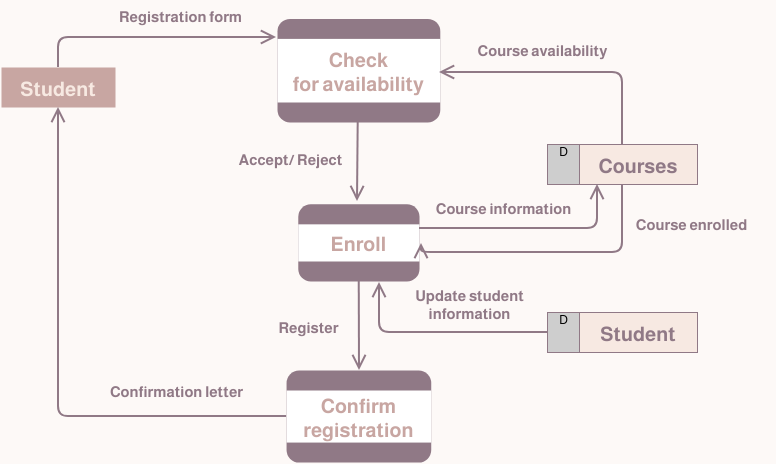
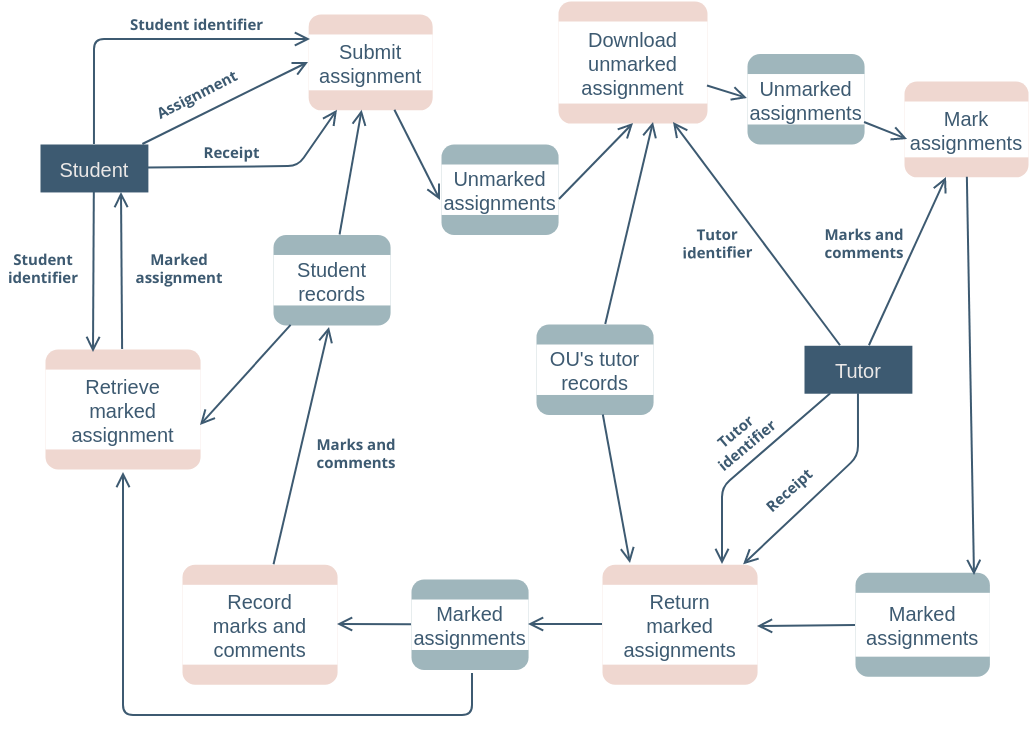
Data Flow Diagram: Student Registration System
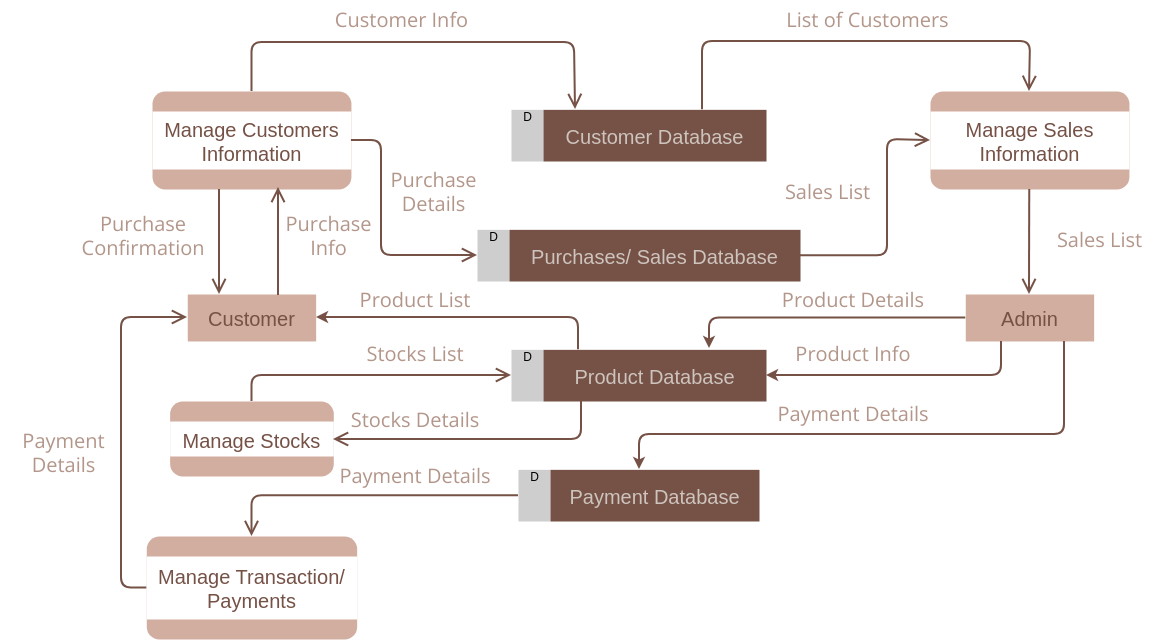
Data Flow Diagram: Inventory Management System
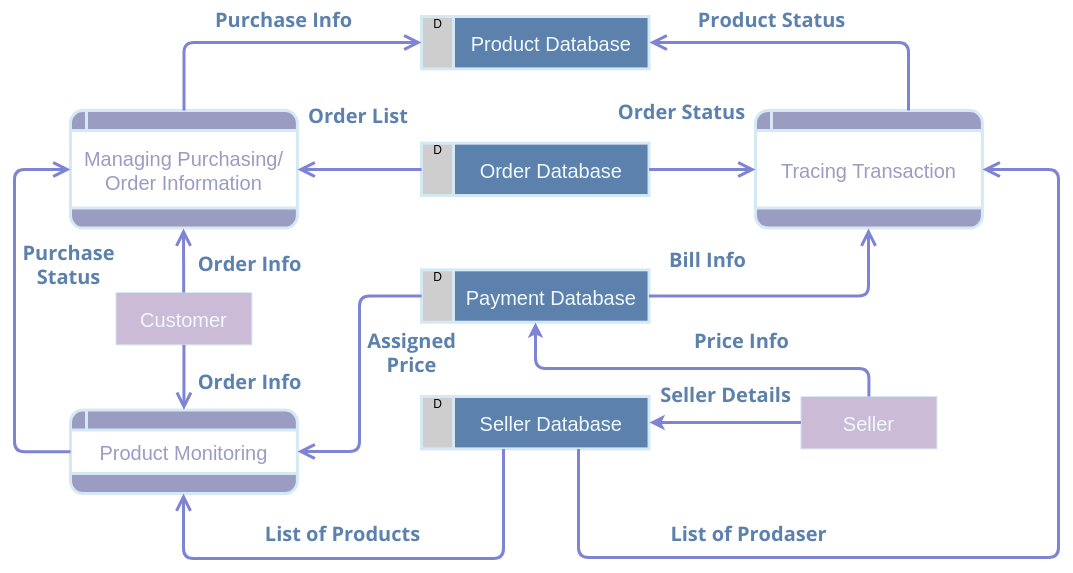
Data Flow Diagram: Online Shopping System
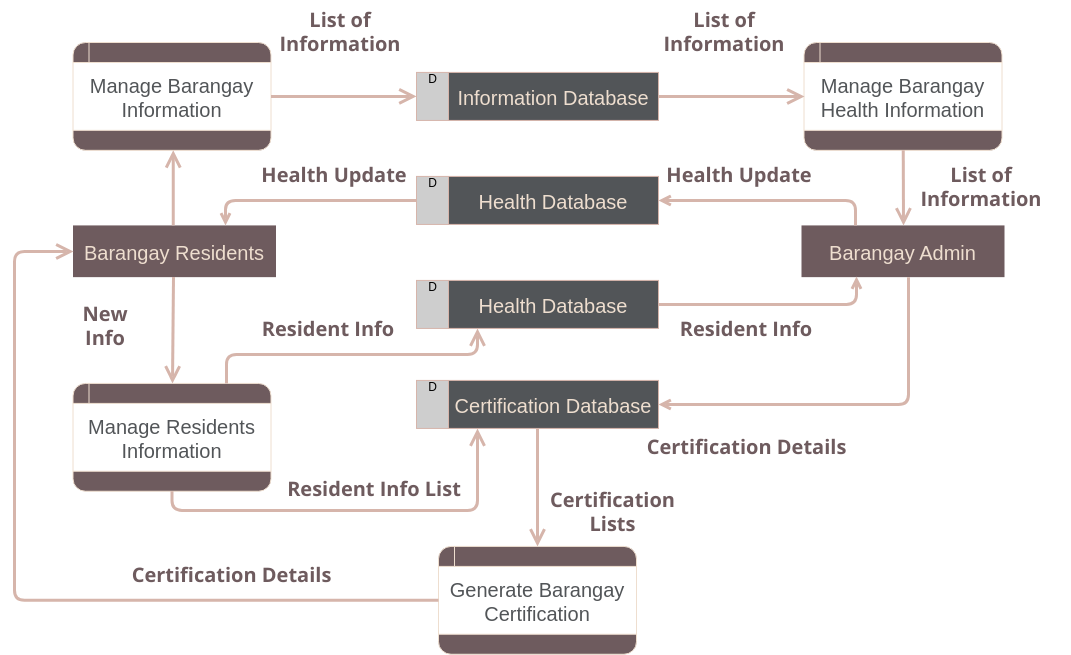
Data Flow Diagram: Barangay Information System
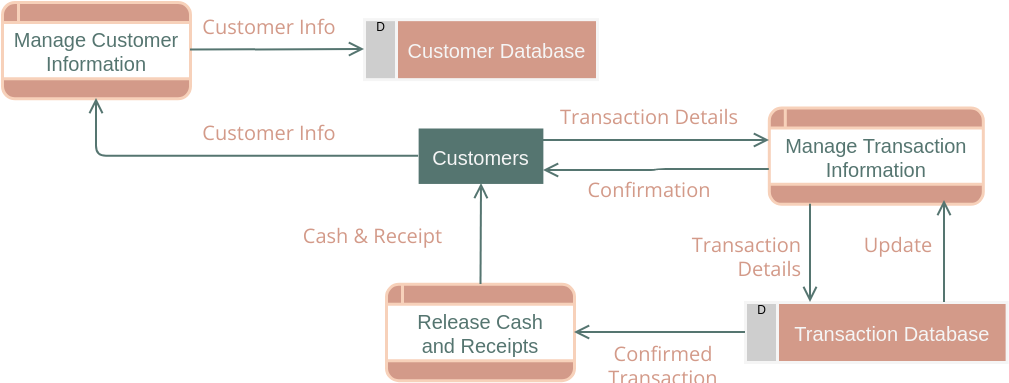
Data Flow Diagram Example: ATM
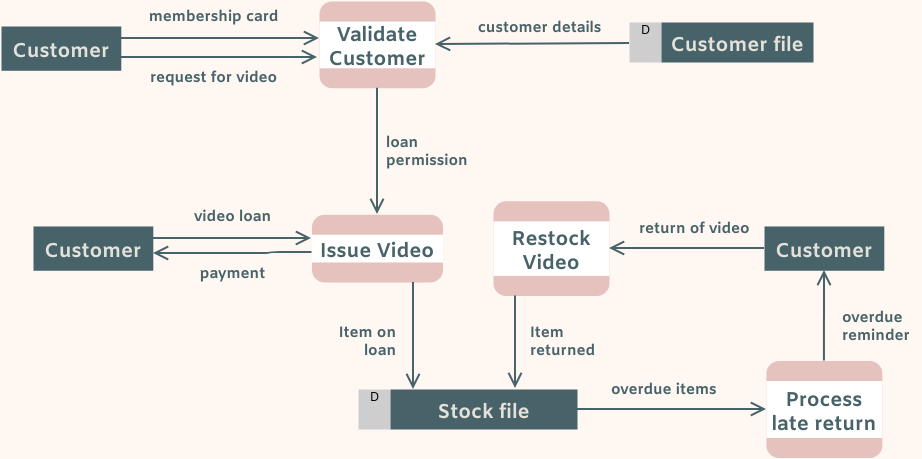
Video Rental System Data Flow Diagram
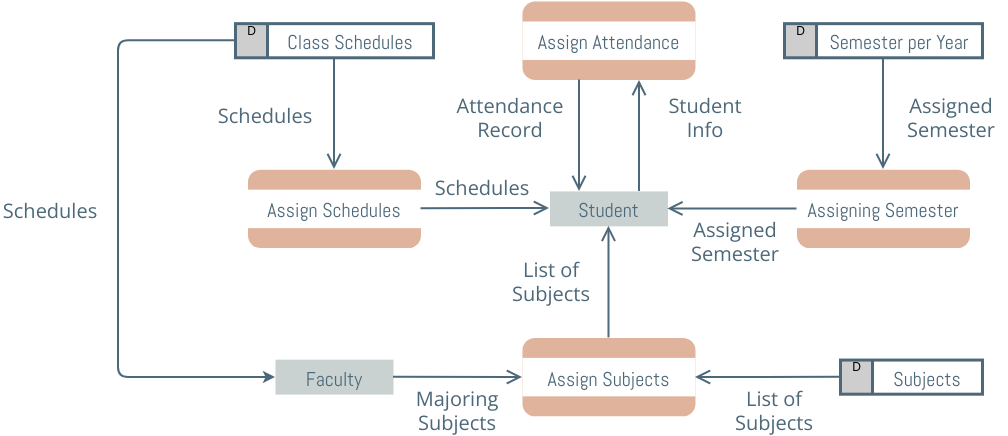
Data Flow Diagram: Student Management System
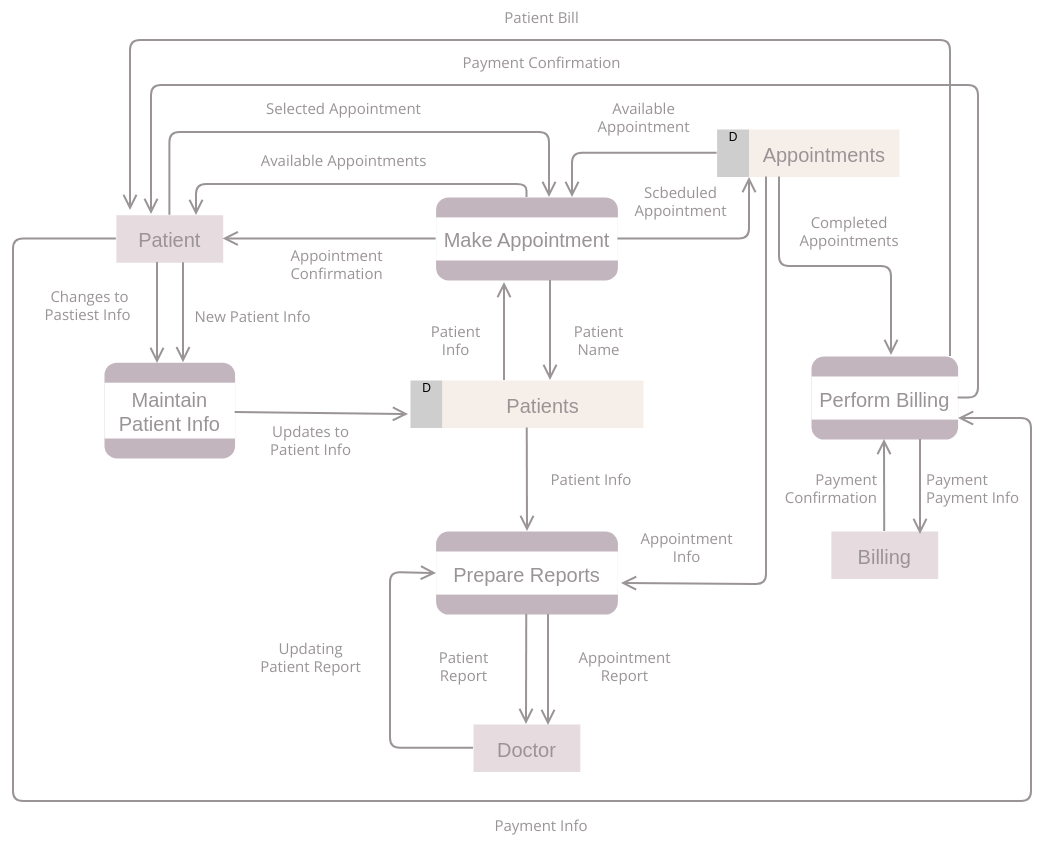
Data Flow Diagram: Hospital Information System
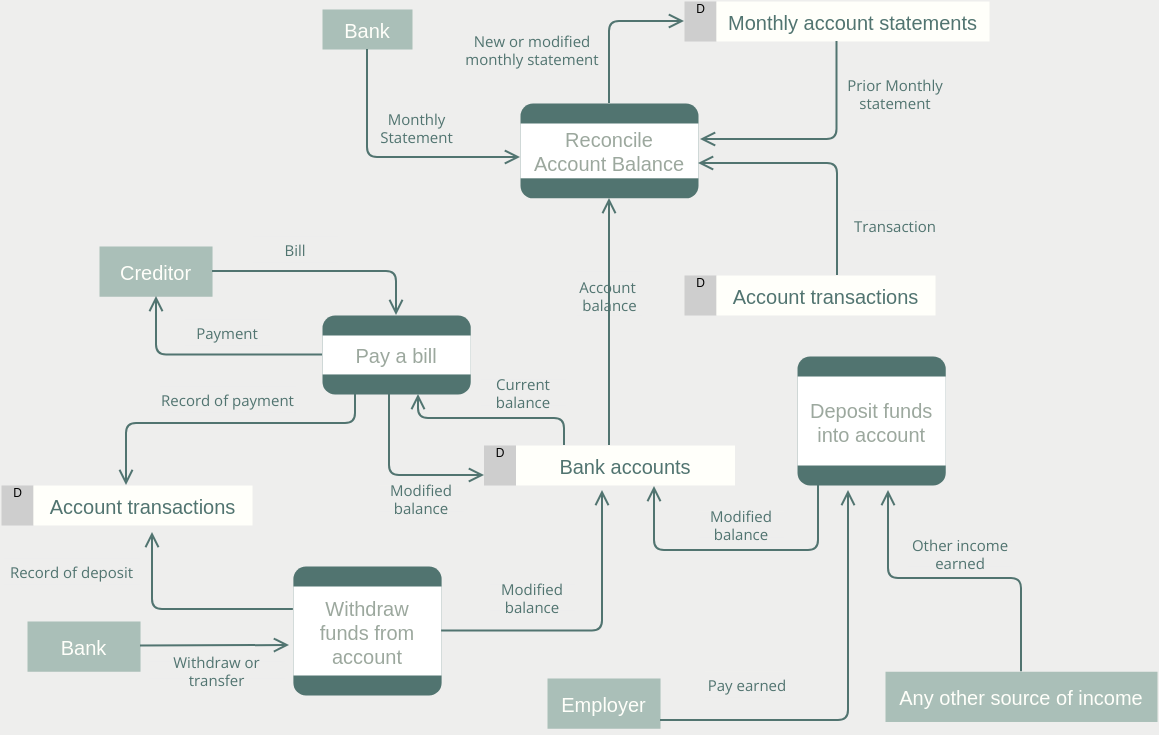
Data Flow Diagram Example: Bank System
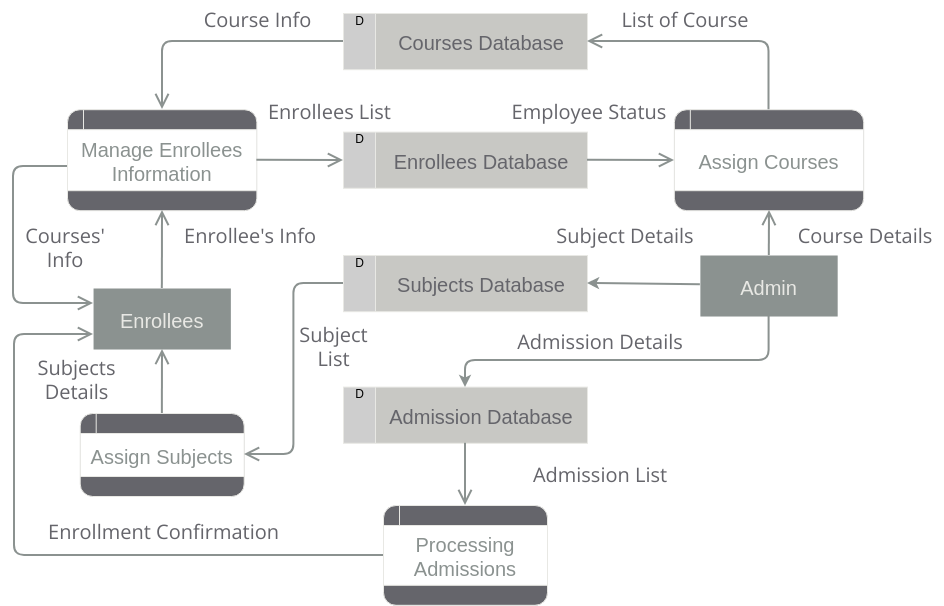
Data Flow Diagram: Student Enrollment System
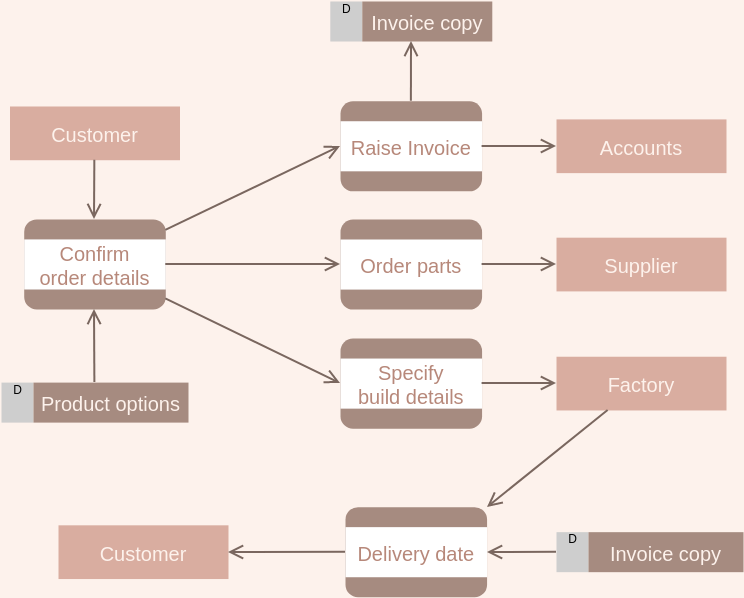
Data Flow Diagram Example: Parts Ordering
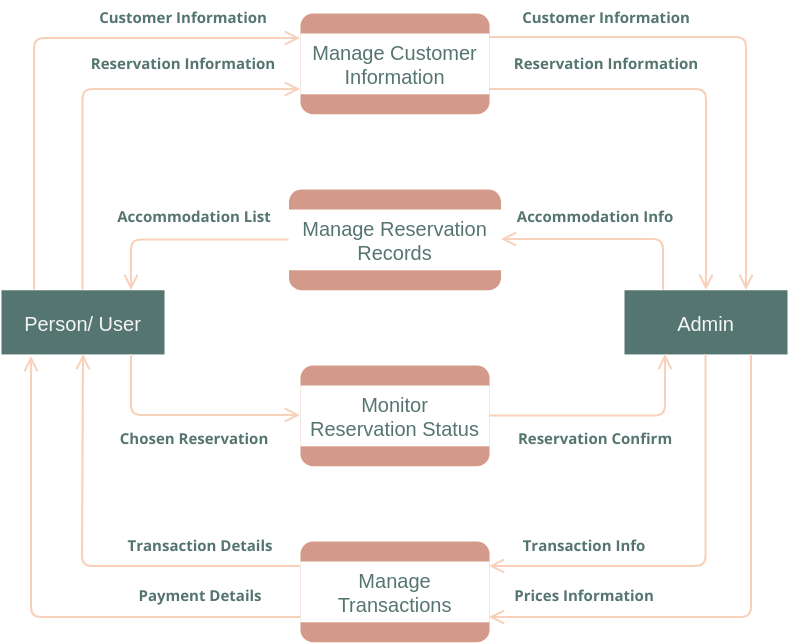
DFD Example: Airline Reservation System
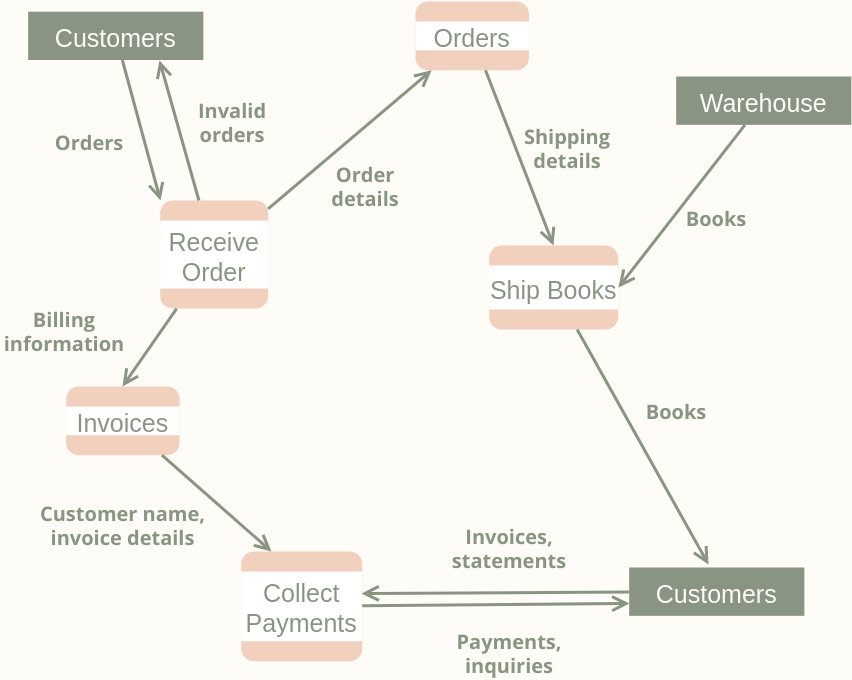
DFD Example: Simple Order Processing
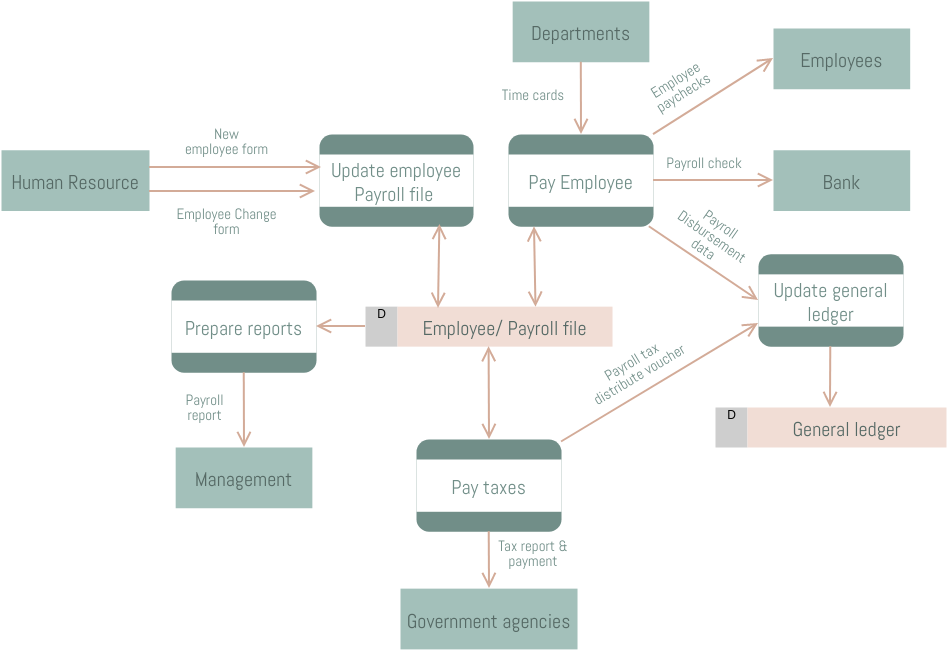
Data Flow Diagram: Accounting Information System
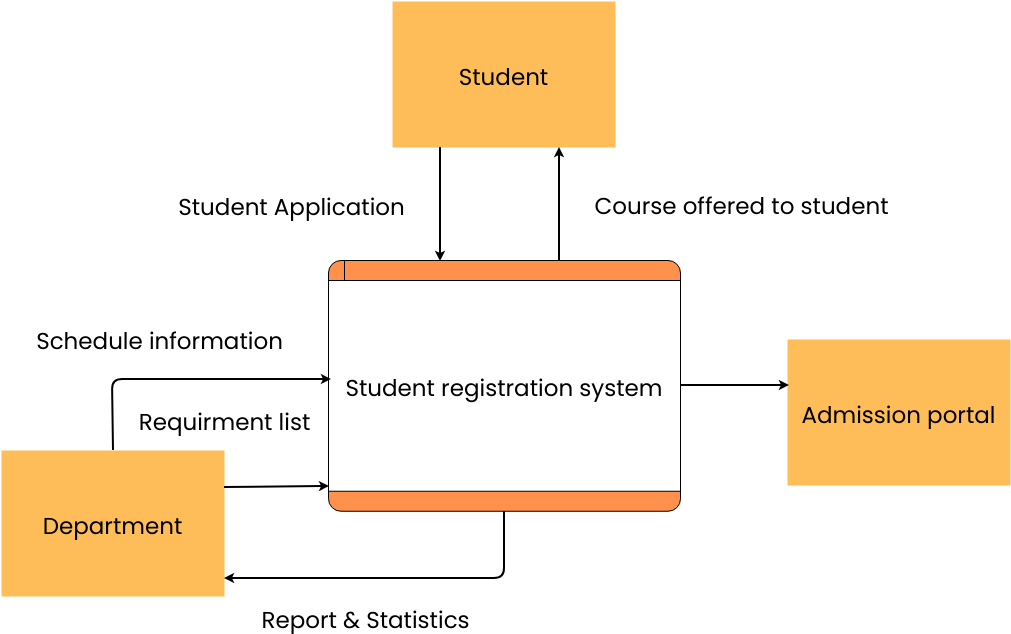
Student Registration System Data Flow
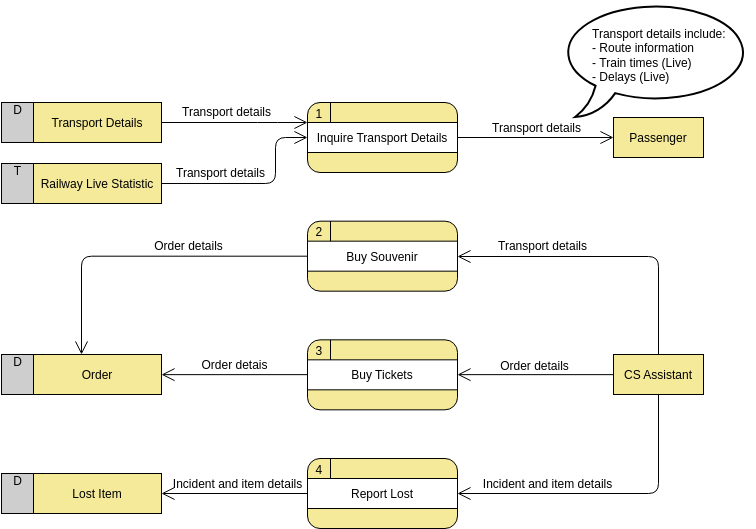
Customer Service System (Railway Company)
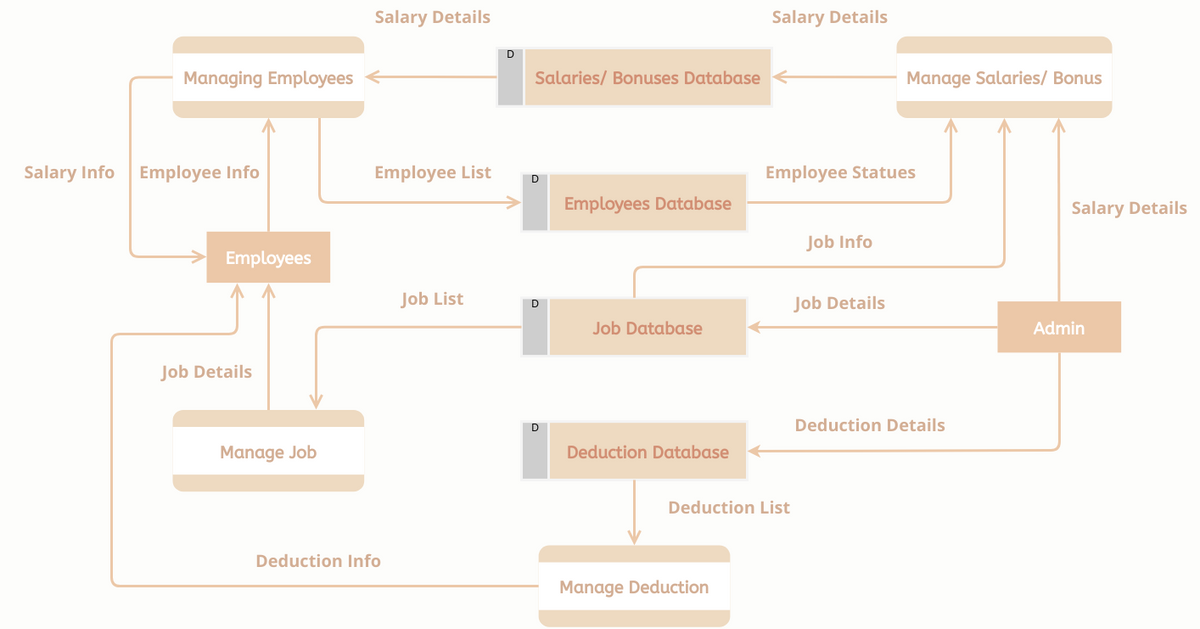
Data Flow Diagram: Payroll Management System
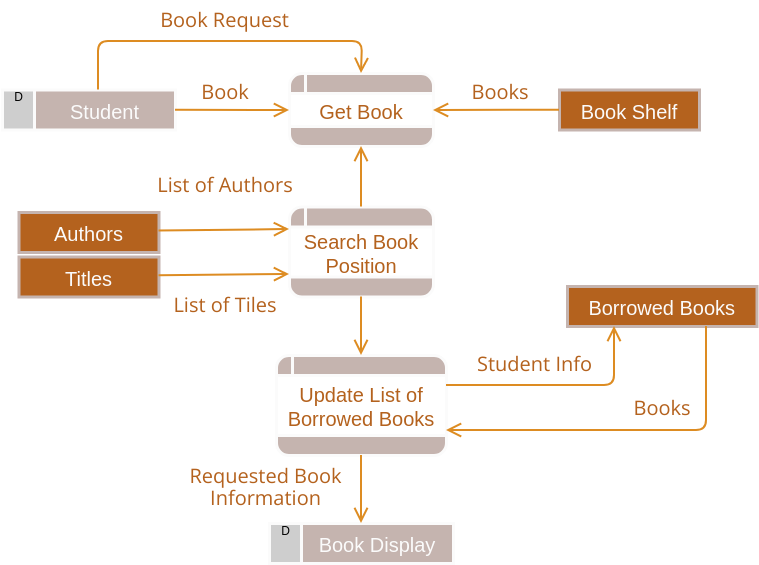
DFD Example: Library Management System
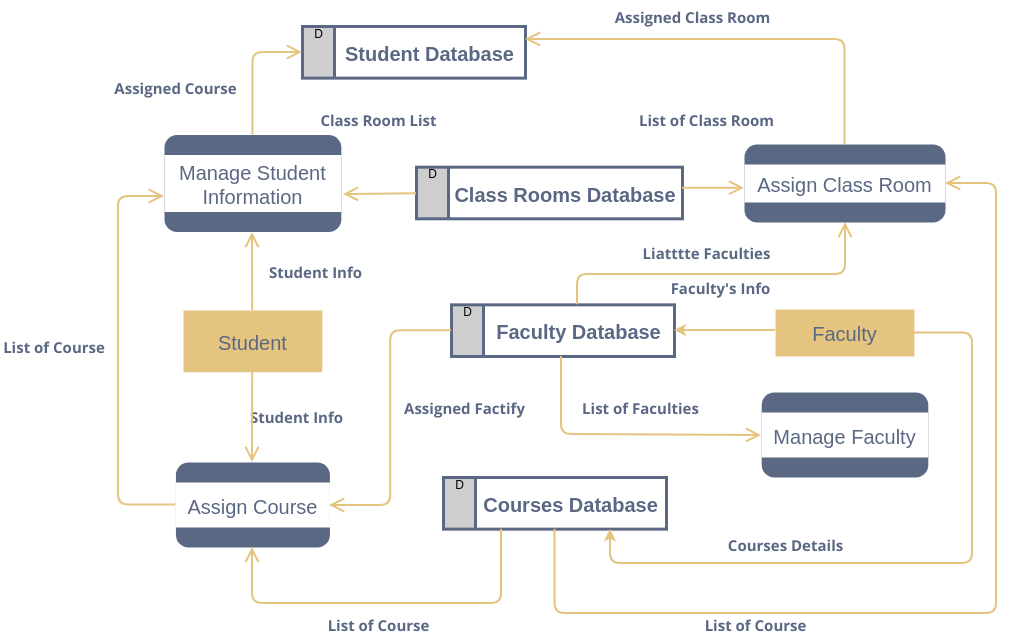
Data Flow Diagram: University Management System
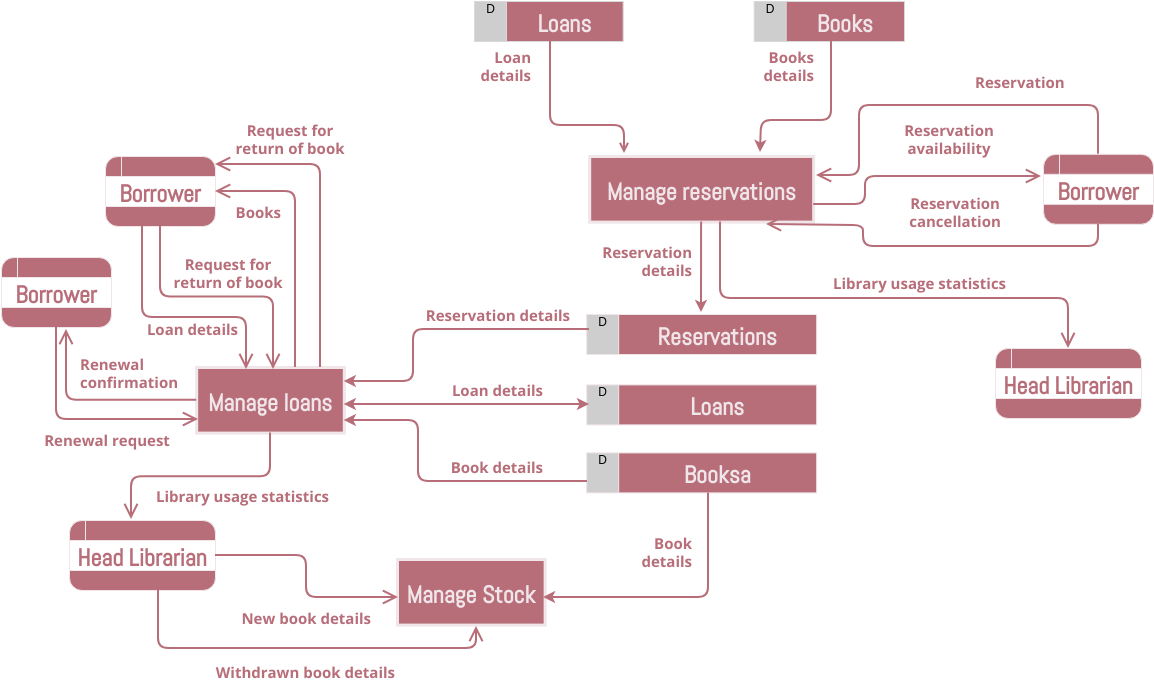
Data Flow Diagram: Library Management System
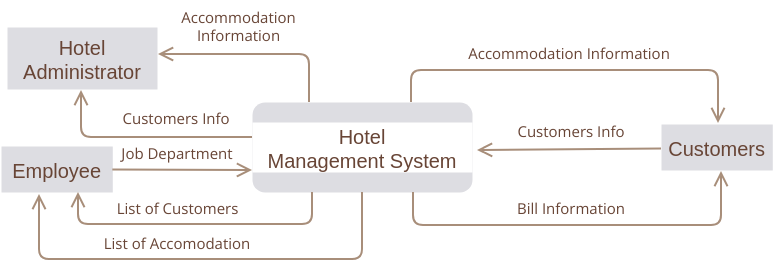
Data Flow Diagram: Hotel Management System

Data Flow Diagram: Collage Management System
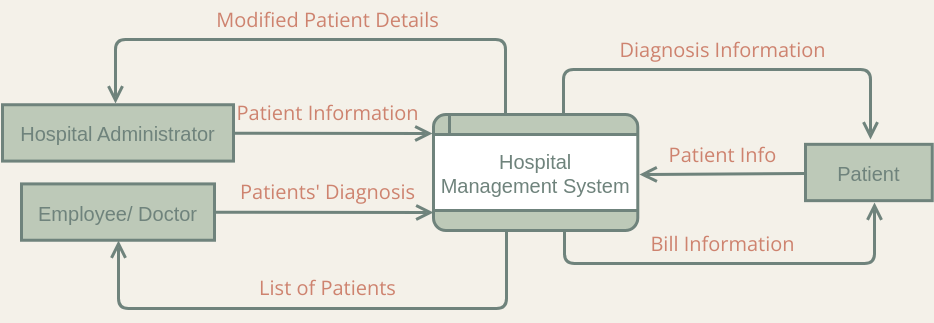
Data Flow Diagram: Hospital Management System


