


Introduction
In the ever-evolving landscape of Information Technology, where complexities abound and processes intertwine, the need for a clear and structured approach to understanding information movement becomes paramount. This comprehensive guide aims to delve into the essence of Data Flow Diagrams, offering a roadmap for both novices and seasoned professionals in navigating the complexities of IT processes. From its historical roots in the 1970s to its contemporary relevance in Business Analysis and process visualization, DFD emerges as a beacon of clarity.
Join us on this journey as we explore the fundamental components of DFD, understand the levels of detail it offers, decipher its operational mechanism, and grasp the significance of accurate assessments. Whether you’re a business analyst, a developer, or a stakeholder seeking a holistic view of projects, this guide is your key to unlocking the potential of Data Flow Diagrams.
Let’s embark on this enlightening expedition, where efficiency and clarity merge seamlessly to decode the intricate tapestry of information movement with Data Flow Diagrams.
Understanding Data Flow Diagrams
A Data Flow Diagram (DFD) is a powerful visual tool that elucidates the flow of information within a system or across various departments in an organization. Originating in the 1970s, credited to Ed Yourdon and Larry Constantine, DFD was conceived to streamline workflow documentation and presentation.
DFD proves invaluable in both Business Analysis and business process visualization, offering a clear depiction of operational relationships and dependencies.
Essential Components of DFD:
DFD employs a simplified notation system comprising four key elements:
- Process: Represents transformative processes converting input into output.
- Data Flow: Illustrates the movement of information within the system.
- Datastore: Acts as repositories for static data, such as databases or buffers.
- External Entity: Signifies sources or destinations of information beyond system boundaries.
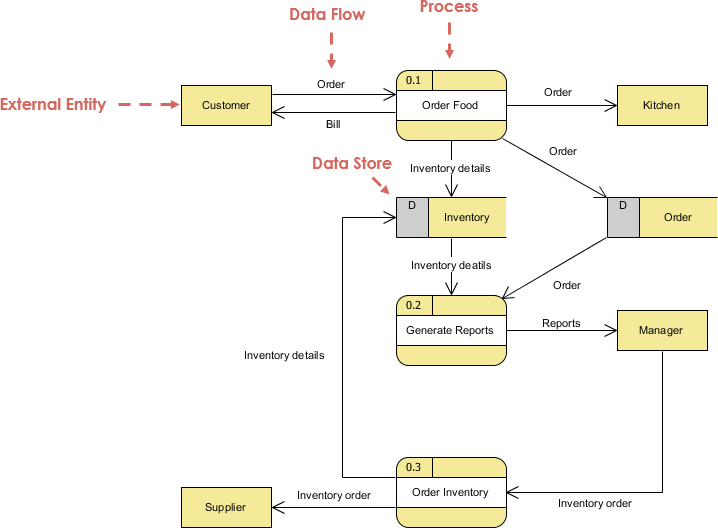
The flexibility of two widely used notations, DeMarco-Yourdon and Gane-Sarson, enhances DFD’s adaptability.
Levels of Detail in DFD
DFD facilitates multi-layered depictions, enabling the identification of weaknesses and the implementation of corrective measures. The hierarchical levels include:
- Level 0 or Context Diagram: Offers a broad overview of the entire system.
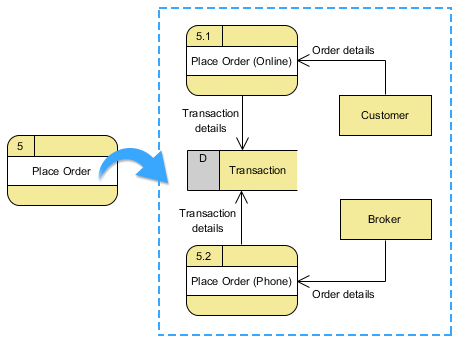
- Level 1: Provides a more detailed breakdown of specific elements.
- Level 2: Further details processes, often accompanied by extensive commentary.
- Level 3 and beyond: Elaborates on specific processes with increasing detail.
Each level serves a distinct purpose, catering to diverse audiences and stages of project development.
Operational Mechanism of DFD
DFD relies on a simplified notation system, utilizing rectangles, circles, arrows, and abbreviations to visually represent processes and data flows. The visual component is paramount, ensuring a clear understanding of the system’s intricacies.
Ensuring the Accuracy of Data Flow Diagrams (DFD)
Several guidelines assist in assessing the accuracy of a Data Flow Diagram:
- Every process should incorporate a minimum of one input and one output.
- Each datastore must be equipped with at least one inflow and one outflow of data.
- Stored information should play a functional role in a process.
- Processes should be interlinked, establishing a harmonious and interconnected workflow.
- Data delivery should be targeted, ensuring that information reaches processes where it is needed.
- Data stores within the Data Flow Diagram (DFD) should be complemented by input data flows to maintain completeness.
The Significance of Data Flow Diagrams
DFD serves as a strategic tool for gaining project insight and improvement. Acting as a meticulous editor, it guides through each stage of a process, exposing inadequacies or missed elements. A well-constructed DFD provides a comprehensive view of the project, allowing information layering based on defined hierarchies.
Conclusion
In the dynamic landscape of Information Technology, where complexity often shrouds processes, Data Flow Diagrams (DFD) emerge as a beacon of clarity. This comprehensive guide navigates the historical roots and contemporary significance of DFD, presenting it as an indispensable tool in Business Analysis and process visualization.
The guide explores the essential components of DFD, including processes, data flows, datastores, and external entities, utilizing a flexible notation system. Levels of detail, from the broad context diagram to intricate process delineations, cater to diverse audiences and project development stages.
The journey concludes by emphasizing the strategic significance of Data Flow Diagrams. They serve as meticulous editors, guiding projects through stages, exposing inadequacies, and providing a comprehensive view. DFD is more than a visual tool; it is a key to efficiency and clarity, unraveling the complexities of information movement in the pursuit of progress.
Effortless Data Flow Diagram Creation Tool
A Data Flow Diagram (DFD) serves as a visual depiction of information flow within a system, unraveling the intricacies of how data moves. Utilizing DFD enables the identification of information inputs and outputs for specific entities or sub-processes within a defined system or process scope, elucidating the type and format of information essential for process completion.
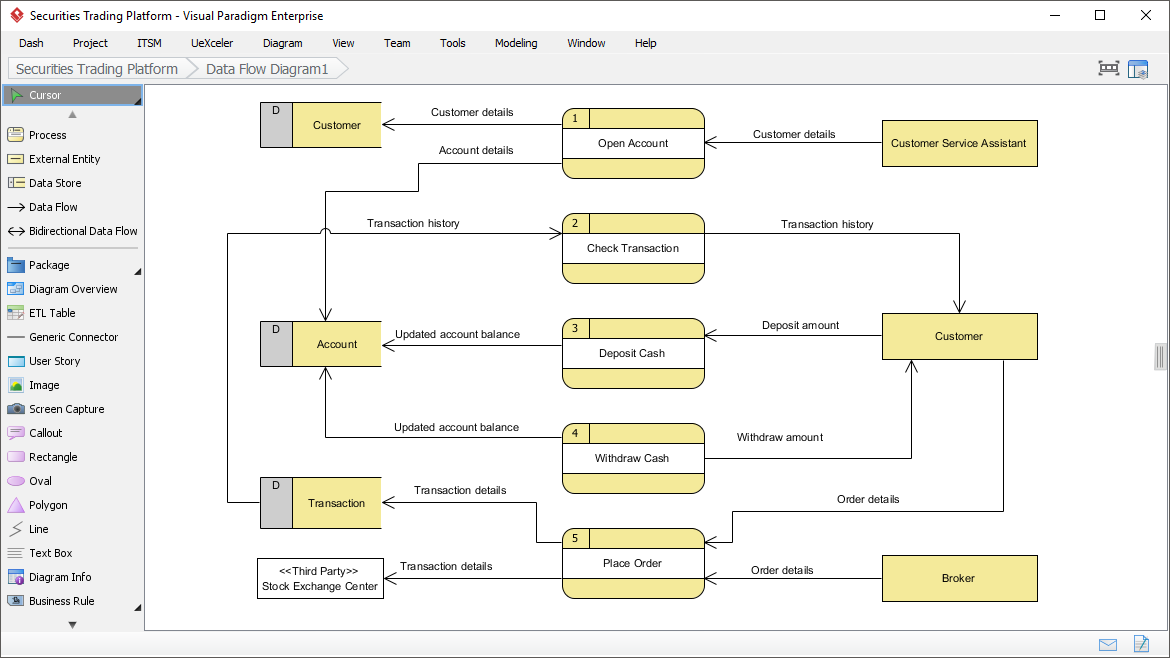
Experience swift and uncomplicated DFD creation with Visual Paradigm. Our platform boasts a myriad of editing and modeling features that simplify the modeling process. From intuitive drag-and-drop shape creation to precise positioning facilitated by alignment guides, element reusability, and more—Visual Paradigm empowers you to create DFDs effortlessly.