


In UML, diagrams can be broadly categorized into two main categories: structure diagrams and behavior diagrams. Here’s a brief description of each of the 14 types of diagrams and their categorization: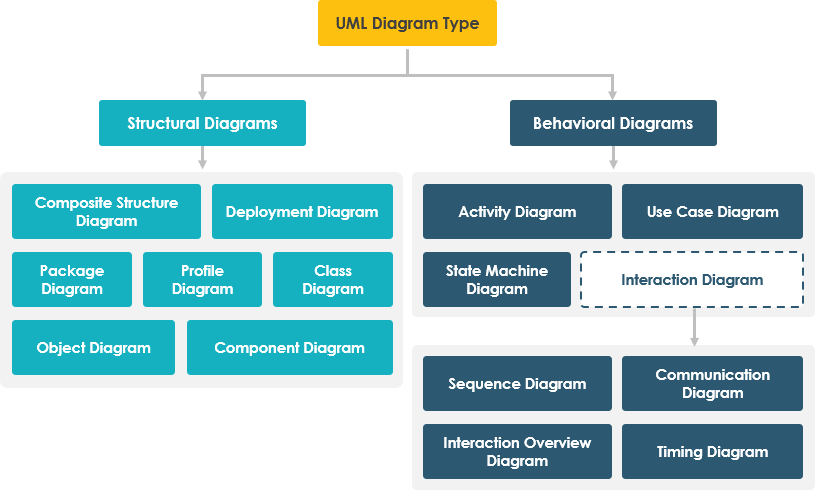
Structure Diagrams (Static Modeling):
- Class Diagram (Structure):
- Represents the static structure of a system, including classes, attributes, and relationships.
- Object Diagram (Structure):
- Shows a snapshot of instances at a specific point in time, depicting objects and their relationships.
- Package Diagram (Structure):
- Organizes elements into packages, providing a high-level view of the system’s organization.
- Component Diagram (Structure):
- Focuses on system components and their interactions, useful for system architecture.
- Composite Structure Diagram (Structure):
- Represents the internal structure of a class, including parts, ports, and connectors.
- Deployment Diagram (Structure):
- Depicts the physical deployment of components and nodes in a system.
Behavior Diagrams (Dynamic Modeling):
- Use Case Diagram (Behavior):
- Illustrates system functionality from the user’s perspective, showing actors and use cases.
- Activity Diagram (Behavior):
- Models the flow of activities and actions within a system, including parallel and conditional behavior.
- State Machine Diagram (Behavior):
- Represents the behavior of an object or system as a finite state machine with states and transitions.
- Sequence Diagram (Behavior):
- Shows interactions between objects over time, emphasizing the sequence of messages.
- Communication Diagram (Behavior):
- Emphasizes the relationships between objects and how they collaborate to achieve a task.
- Interaction Overview Diagram (Behavior):
- Combines activity and sequence diagrams to provide an overview of complex interactions.
- Timing Diagram (Behavior):
- Focuses on the timing constraints of interactions, including lifelines and events.
- profile diagram (Structure)
- A special type of UML diagram used to extend the UML metamodel by defining custom stereotypes, tagged values, and constraints. Profile diagrams are a part of the UML extension mechanism, allowing you to tailor UML to suit specific modeling needs or domains.
These UML diagrams serve different purposes in modeling a software system, with structure diagrams focusing on the static aspects and behavior diagrams addressing the dynamic aspects. Choosing the appropriate diagram type depends on the specific aspect of the system you want to represent or communicate.
Distinguishing Between structure and behavior diagrams
Structure diagrams provide a static view of a system, emphasizing its components, relationships, and organization, while behavior diagrams offer a dynamic view, focusing on the runtime behavior, interactions, and processes within the system. These two categories of diagrams serve distinct purposes and are essential for comprehensively modeling and documenting software systems, addressing both their static and dynamic aspects.
Here’s a table that categorizes each of the 14 types of UML diagrams under the two categories, along with a brief example for each:
Structure Diagrams (Static Modeling):
| Diagram Type | Description | Example |
|---|---|---|
| Class Diagram | Represents static class structure and relationships. | Example: Modeling a library system with classes like Book, Author, and Library. |
| Object Diagram | Shows instances and their relationships at a specific moment. | Example: Displaying specific Book and Member objects in a library system. |
| Package Diagram | Organizes elements into packages or namespaces. | Example: Grouping related classes into a LibraryManagement package. |
| Component Diagram | Depicts physical or logical system components and their connections. | Example: Illustrating software components like databases, web servers, and client applications in a web system. |
| Composite Structure Diagram | Details internal structure of a class with parts, ports, and connectors. | Example: Showing the internal structure of a computer system with components like CPU, RAM, and motherboard. |
| Deployment Diagram | Displays physical deployment of components on nodes or servers. | Example: Representing how web server software components are deployed on physical servers. |
Behavior Diagrams (Dynamic Modeling):
| Diagram Type | Description | Example |
|---|---|---|
| Use Case Diagram | Defines actors and their interactions with the system through use cases. | Example: Modeling how a customer interacts with an ATM system to withdraw cash. |
| Activity Diagram | Depicts workflows, processes, and actions in a system, including branching and parallelism. | Example: Illustrating the steps involved in processing an online order. |
| State Machine Diagram | Represents the behavior of an object or system as a finite state machine with states and transitions. | Example: Modeling the states and transitions of a traffic signal system. |
| Sequence Diagram | Displays interactions between objects or components over time through messages. | Example: Showing the sequence of messages between a user and a database system during a login process. |
| Communication Diagram | Focuses on object interactions and their collaborations in a system. | Example: Visualizing how objects in a chat application exchange messages. |
| Interaction Overview Diagram | Combines elements of activity and sequence diagrams to provide an overview of complex interactions. | Example: Simplifying a complex order processing workflow in a retail system. |
| Timing Diagram | Specifies timing constraints of interactions, including lifelines and events. | Example: Showing the timing of data transmission between devices in a network. |
These tables categorize each UML diagram into either the “Structure Diagrams” (Static Modeling) category or the “Behavior Diagrams” (Dynamic Modeling) category, along with brief descriptions and example scenarios for each type.
The Multifaceted Role of UML Diagrams in Software Design
Different types of diagrams in software design serve specific purposes and provide various perspectives on a software system. Here are key reasons why we need different types of diagrams:
- Clarity and Communication: Different stakeholders in a software project, including developers, architects, testers, and business analysts, have varying needs for understanding the system. Using different types of diagrams helps tailor information to their specific roles and makes communication more effective.
- Abstraction Levels: Software systems are complex, and different aspects need to be considered at different levels of abstraction. Some diagrams, like class diagrams, provide a high-level structural view, while others, like sequence diagrams, offer detailed behavioral insights.
- Problem Solving: Different problems in software design and development require different approaches. For instance, when modeling the static structure of a system, class diagrams are more appropriate, whereas sequence diagrams are suitable for understanding dynamic behavior.
- System Understanding: Different diagrams provide different lenses through which to view the system. This helps in gaining a holistic understanding of the system, including its architecture, behavior, interactions, and deployment.
- Documentation: Comprehensive documentation is crucial for software projects. Using various types of diagrams allows for well-structured, visual documentation that can be easily referenced by team members at different stages of development.
- Requirements Analysis: Use case diagrams and activity diagrams are valuable for capturing and analyzing system requirements and workflows. They help ensure that software aligns with user needs.
- Architectural Design: Component diagrams and deployment diagrams are essential for architectural design. They help in planning the structure of the system and how it will be deployed in a real-world environment.
- Testing and Validation: Sequence diagrams and state machine diagrams aid in designing test cases and validating the system’s behavior against requirements.
- Decision-Making: Different types of diagrams provide different insights. During the decision-making process, architects and project managers can use these diagrams to assess trade-offs and make informed choices.
- Ease of Maintenance: Diagrams help in maintaining and evolving software. When developers need to modify or extend a system, these visual representations can serve as valuable references for understanding the existing structure and behavior.
Summary
The diversity of UML diagrams in software design caters to the multifaceted nature of software systems. Each diagram type has a specific purpose and provides a unique perspective, making them indispensable tools for various stages of software development, from initial design to implementation, testing, and maintenance.