


Introduction
In the realm of software engineering and system modeling, the Unified Modeling Language (UML) serves as a vital tool for visualizing, designing, and documenting complex systems. UML offers various diagram types to address different aspects of a system’s structure and behavior. Among these, Interaction Overview Diagrams, Interaction Diagrams (Sequence and Communication Diagrams), and Activity Diagrams hold significant prominence. Each of these diagram types serves a distinct purpose and provides unique insights into system dynamics. In this comparative analysis, we will explore and contrast these UML diagrams, shedding light on their intended use, key elements, and advantages. This examination aims to provide a clearer understanding of when and how to employ these diagram types in software and system modeling.
In UML (Unified Modeling Language), there are several types of diagrams used to model different aspects of a system, including interaction overview diagrams, interaction diagrams, and activity diagrams. Here’s a brief overview of each:
Interaction Overview Diagram
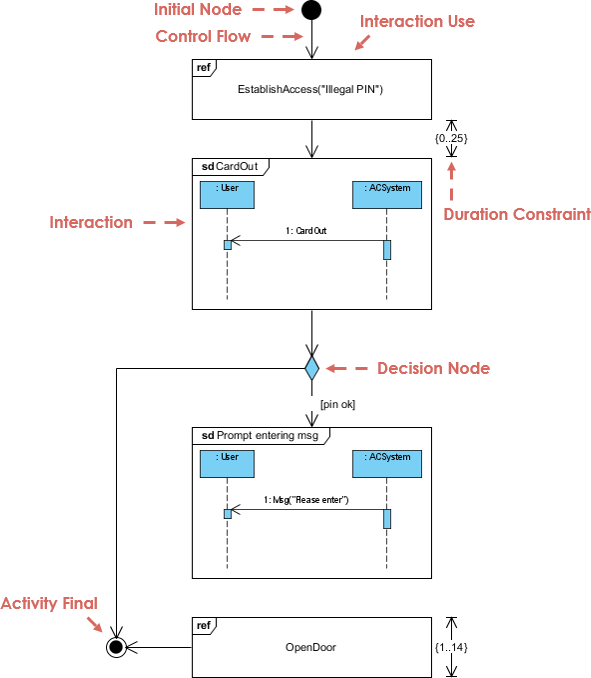
An Interaction Overview Diagram is a high-level diagram used to show the flow of interactions between different parts of a system or between various systems or components.
-
- It provides an overview of how various interactions, typically represented by sequence diagrams or communication diagrams, are organized and connected.
- Interaction overview diagrams are often used to show the overall structure of interactions in complex scenarios, making them easier to understand.
- They can include elements like decision nodes, merge nodes, and interaction fragments to represent conditional flows and loops within the interactions.
- Interaction overview diagrams are especially useful when you want to present a simplified view of complex interactions.
Interaction Diagrams
Interaction diagrams in UML are used to model the dynamic behavior of a system by showing how objects or components interact with each other over time.
-
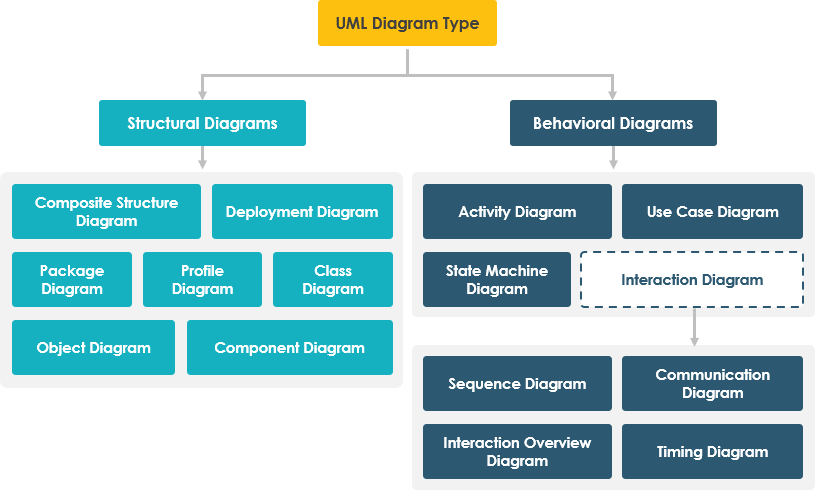
- There are two main types of interaction diagrams: Sequence Diagrams and Communication Diagrams.
- Sequence Diagrams: These diagrams show the chronological sequence of messages or interactions between objects or components. They are particularly useful for modeling scenarios where the order of interactions matters.
- Two less commonly encountered interaction diagrams are the Timing diagram and the Interaction Overview Diagram, both depicted in the above Figure.
- There are two main types of interaction diagrams: Sequence Diagrams and Communication Diagrams.
Communication Diagrams: Communication diagrams (formerly known as Collaboration Diagrams) focus on the relationships between objects or components and how they communicate with each other. They emphasize the structural aspects of interactions.
Activity Diagram
-
-
-
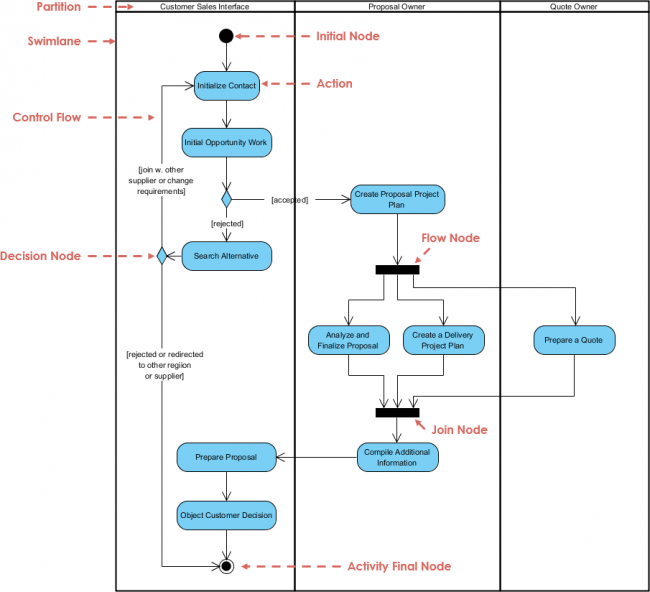
- An Activity Diagram in UML is used to model the flow of activities or processes within a system or a specific component.
- It is typically used to represent business processes, workflows, or the behavior of individual objects or components.
- Activity diagrams use various elements such as actions, decision nodes, control flows, and swimlanes to model the flow of activities and decision points.
- They are especially useful for visualizing complex workflows, making it easier to understand how different tasks or actions are coordinated.
-
-
Interaction overview diagram vs interaction diagram vs activity diagram
Here’s a table comparing Interaction Overview Diagrams, Interaction Diagrams (Sequence and Communication Diagrams), and Activity Diagrams in UML:
| Aspect | Interaction Overview Diagram | Interaction Diagrams (Sequence/Communication) | Activity Diagram |
|---|---|---|---|
| Purpose | Provide an overview of interactions in complex scenarios. | Model dynamic interactions between objects/components. | Model the flow of activities or processes within a system. |
| Focus | High-level structure of interactions. | Detailed chronology of interactions or relationships. | Flow of activities and decision points. |
| Types of Elements | Decision nodes, merge nodes, interaction fragments. | Lifelines, messages, objects, fragments (for sequence diagrams); Objects, links, messages (for communication diagrams). | Actions, control flows, decision nodes, swimlanes. |
| Order of Events | Less emphasis on the exact order of interactions. | Strictly represents the chronological order of interactions. | Represents the order of activities and decision points. |
| Use Cases | Useful for simplifying complex interaction scenarios. | Commonly used for modeling scenarios with precise timing and ordering requirements. | Suitable for modeling workflows, business processes, or system behavior. |
| Granularity | High-level overview of interactions. | Detailed representation of interactions. | Represents both high-level processes and detailed steps. |
| Notation | Special elements for conditional flows and loops. | Lifelines, messages, objects (for sequence diagrams); Objects, links, messages (for communication diagrams). | Actions, decision points, control flows, swimlanes. |
| Symbols and Icons | Decision diamonds, rectangles, clouds, etc. | Lifeline boxes, arrows, messages, etc. | Rectangles, diamonds, arrows, swimlane partitions, etc. |
| Complexity Management | Helps manage complexity by providing a simplified view. | Emphasizes the complexity of interactions. | Manages complexity through the visualization of activities. |
Please note that the choice of diagram depends on the specific modeling needs and the level of detail required for representing interactions or activities in a system. Interaction overview diagrams provide a high-level overview, interaction diagrams offer a detailed view of interactions, and activity diagrams are used for modeling the flow of activities and processes.
Summary
Interaction overview diagrams provide a high-level overview of interactions within a system, while interaction diagrams (sequence diagrams and communication diagrams) focus on modeling the dynamic interactions between objects or components. Activity diagrams, on the other hand, are used to model the flow of activities or processes within a system. The choice of which diagram to use depends on the specific modeling needs and the level of detail required for representing interactions or activities in a system.