


Introduction
In the vast landscape of information and technology, understanding and effectively managing data is crucial for success. Whether you’re delving into the depths of the Internet, optimizing marketing strategies, or deciphering customer behavior, the key lies in organizing the flow of data. One powerful tool that simplifies this process is the Data Flow Diagram (DFD). Fear not, it’s not as technical as it may sound.
What is a Data Flow Diagram (DFD)?
A Data Flow Diagram is a visual representation that maps out the inputs, processes, and outputs of data within a system. The flow of data is illustrated with lines and arrows, while outcomes are depicted as shapes like rectangles and ovals. This diagram provides a logical and organized view of how data moves through a system, making complex processes more comprehensible.
Creating a DFD
DFDs can be hand-drawn or created using sophisticated software, depending on the complexity of the system. They are commonly used for designing new systems or evaluating existing ones. The simplicity of DFD allows for easier communication of intricate processes that might be challenging to explain verbally.
Context Diagrams
When a deeper exploration of a specific process is required, a Context Diagram, also known as a Context-level DFD, is employed. This diagram provides greater detail about a single process and illustrates its connections to external entities such as data stores and organizations.
Components of a Data Flow Diagram
Two notable notations for DFDs are Yourdon and Coad, and Gane and Sarson. Both employ squares for external entities, arrows for data flow, and rectangles (or lozenges) for data stores. The main difference lies in the representation of processes.
- External Entities: External entities are external systems that communicate directly with the system under consideration. They are the primary source of incoming and outgoing data, positioned on the outer edges of the diagram.
- Processes: Processes are actions that directly alter the data. Labels are attached to each process to describe the action taking place, which could be calculations, data sorting, or the application of specific business rules.
- Data Stores: Data stores are files or storage areas containing information that can be retrieved later. They are usually represented as database tables or spreadsheets with labels explaining their purpose.
- Data Flow: The lines with arrows representing the flow of data between external entities, processes, and data stores. These lines, marked with labels, tie all the information together.
Understanding DFDs
For those unfamiliar with programming or engineering, DFDs might seem complex. However, at their core, they explain what happens to data when a specific action is performed—from input to output. Simple DFDs are monochromatic, while more intricate ones may use multiple colors to represent different variables.
DFD Rules
To create meaningful diagrams, adhere to these rules:
- Each process and data store should have at least one input and output.
- Data stores should flow through a process.
- Every process in DFDs should connect to another process or a checkpoint like a data store.
Creating a Data Flow Diagram
While some engineers prefer the traditional hand-drawn method, modern software solutions offer a more efficient approach. Visual Paradigm stands out as an ultimate choice for those seriously evaluating DFD solutions.
Conclusion:
In the data-driven landscape, mastering the art of visualizing information flow is a powerful skill. Data Flow Diagrams, with their simplicity and clarity, serve as invaluable tools for designing, analyzing, and optimizing systems. Embrace the world of DFDs, and you’ll find yourself navigating the seas of data with confidence and precision.
DFD examples
Data flow diagrams are widely used in the modeling of information systems. In this section, we collected some DFD examples for you as reference. You can create your own DFDs online with those examples, using Visual Paradigm Online.
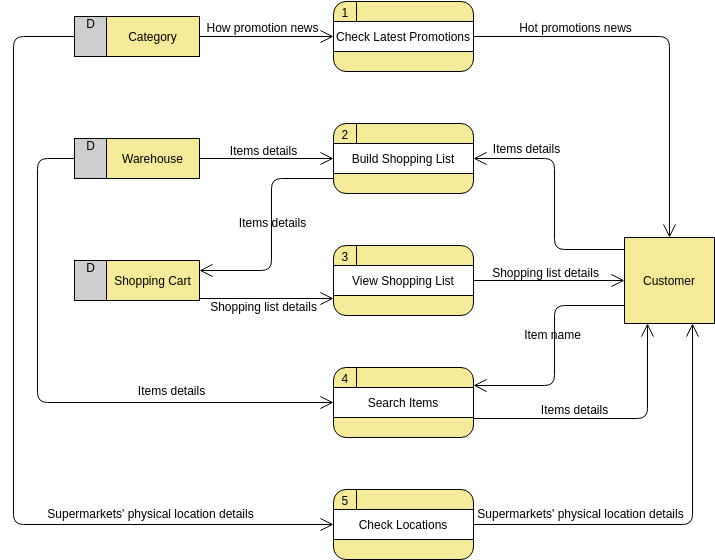
DFD for a supermarket app: (Edit this Data Flow Diagram with Visual Paradigm Online’s DFD maker.)
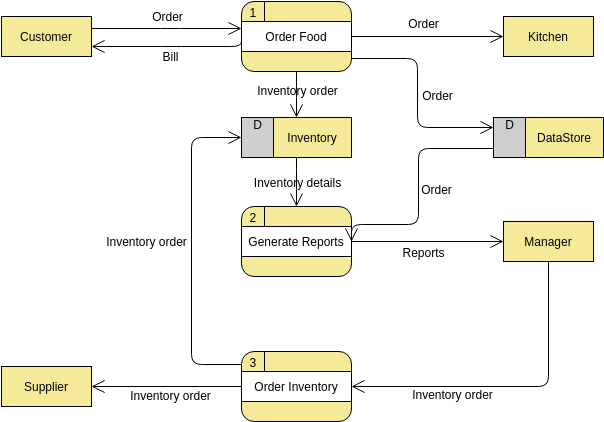
DFD example: Food ordering system (Edit this DFD)
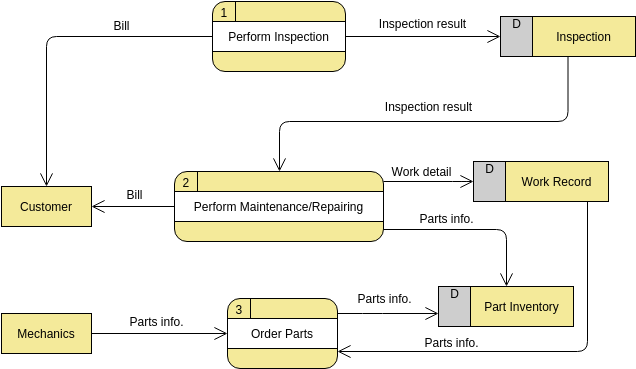
Data flow diagram example: Vehicle maintenance depot (Edit now)
How to make a data flow diagram
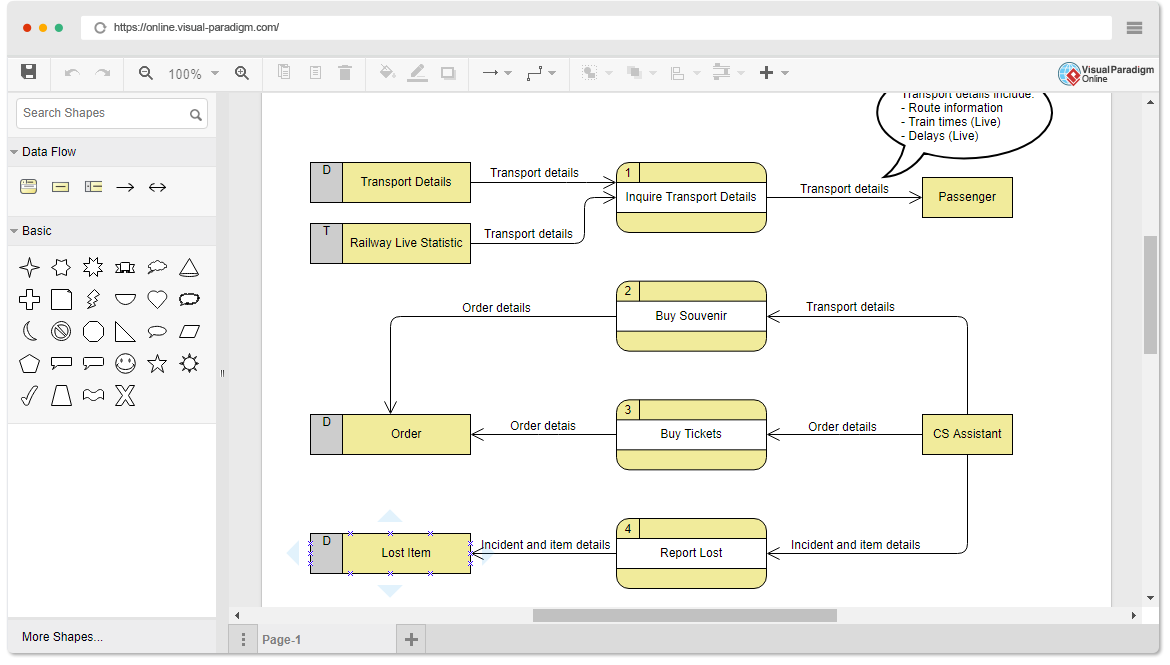
You can create your own DFDs with Visual Paradigm’s online DFD maker. We provide you with a rich set of DFD symbols and DFD templates to visualize the flow of data through your system.
Want to make a DFD now? Try Visual Paradigm. Data flow diagramming is quick and easy with Visual Paradigm.