


State Chart vs Activity Diagram
State chart and activity diagram are two popular tools used in software development to model complex systems. Although both of these diagrams are used for similar purposes, there are significant differences between them. In this article, we will compare state chart and activity diagram and explain their similarities and differences.
State chart Diagrams
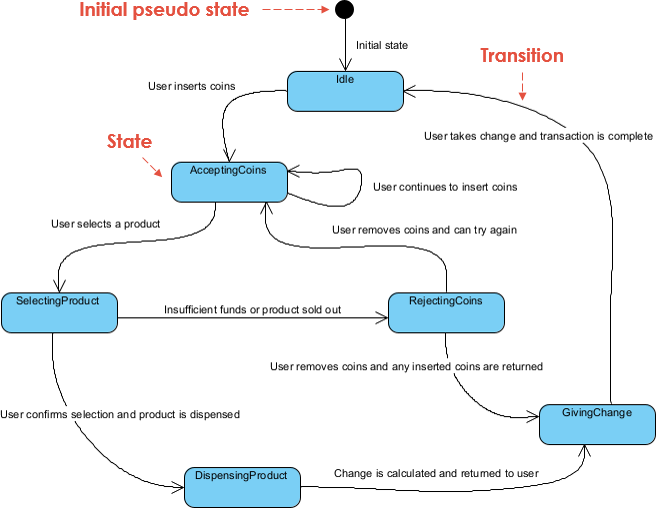
A state chart diagram is a type of diagram used to describe the behavior of a system in response to internal or external events. It shows the different states of an object and the transitions between those states based on the events that occur. State chart diagrams are widely used in software engineering to model the behavior of complex systems.
A state chart diagram consists of states, transitions, and events. States represent the different states of an object or system, transitions represent the movement from one state to another, and events represent the triggers that cause the system to change state. State chart diagrams are typically used to model reactive systems, which are systems that respond to external stimuli.
Activity Diagrams
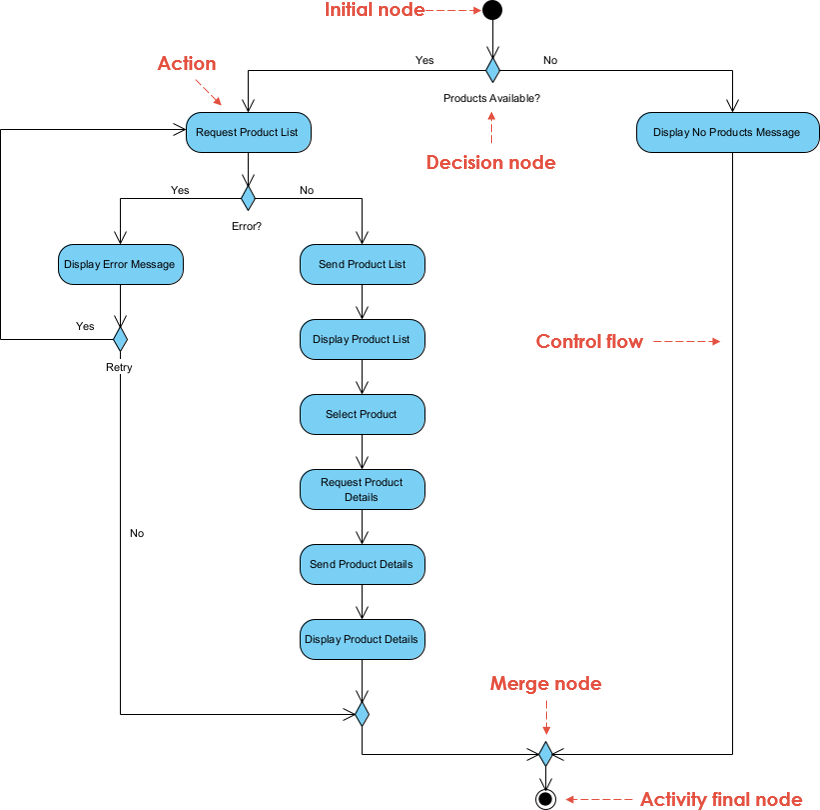
An activity diagram is another type of diagram used to model the behavior of a system. It is a graphical representation of the steps involved in a process or workflow. Activity diagrams are used to model the flow of activities within a system, including decisions, loops, and concurrent activities.
An activity diagram consists of activities, actions, and transitions. Activities represent the major steps involved in the process, actions represent the individual steps within an activity, and transitions represent the movement from one activity to another. Activity diagrams are typically used to model business processes or other non-reactive systems.
Similarities between State chart and Activity Diagram
Both state chart and activity diagrams are used to model the behavior of a system. They both use a graphical representation to show the different states and transitions within a system. They are both useful for understanding and communicating the behavior of a system to stakeholders.
Differences between State chart and Activity Diagram
The primary difference between state chart and activity diagrams is that state chart diagrams are used to model reactive systems, while activity diagrams are used to model non-reactive systems. State chart diagrams focus on the internal state of an object or system and how it responds to external events, while activity diagrams focus on the sequence of activities involved in a process or workflow.
Another key difference between state chart and activity diagrams is that state chart diagrams are typically used to model complex systems, while activity diagrams are used to model simpler systems. State chart diagrams are more complex than activity diagrams because they include the states and transitions of a system, while activity diagrams focus on the activities and actions involved in a process.
Here’s a table summarizing the key similarities and differences between State Chart and Activity Diagrams:
| State Chart Diagram | Activity Diagram | |
|---|---|---|
| Purpose | Model reactive systems | Model non-reactive systems |
| Focus | Internal state of an object or system | Sequence of activities involved in a process or workflow |
| Elements | States, transitions, events | Activities, actions, transitions |
| Complexity | More complex | Less complex |
| Use cases | Embedded systems, control systems, real-time systems | Business processes, workflows, software processes |
As mentioned above, state diagrams and Activity diagram are often confused, but they are two distinct types of diagrams used for different purposes. In the example below, we will compare state diagrams and activity diagrams, and highlight their differences.
A state diagram, shown in the left figure below, represents a state machine that performs actions in response to explicit events. It shows the various states of a system and the transitions between them, based on the occurrence of events. State diagrams are useful for modeling reactive systems that respond to events, such as traffic lights or vending machines.
On the other hand, an activity diagram, shown in the right figure below, represents the flow of activities in a system. It shows the sequence of activities that occur in a system, including decisions, loops, and branching. Activity diagrams are useful for modeling systems that involve a sequence of activities, such as business processes or software algorithms.
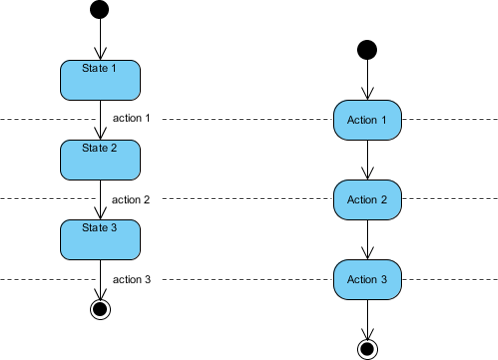
Unlike state diagrams, activity diagrams do not need explicit events to transition from one node to another. Instead, the flow of control in a activity diagram is determined automatically upon completion of activities. The nodes in a activity diagram represent activities or decisions, and the arrows represent the flow of control from one activity to the next.
Learning the Difference by an Example: Contrasting State and Activity Diagrams
In the context of a Vending Machine problem, we can illustrate the differences between state and activity diagrams by modeling the same problem using both types of diagrams. By doing so, we can compare and contrast the unique features of each diagram type.
For example, we can use a state diagram to model the different states of a vending machine and the transitions between those states based on external events. On the other hand, we can use an activity diagram to model the sequence of activities that occur during a vending machine transaction, such as coin insertion, product selection, and coin refund.
Problem 1: Vending Machine
Scenario: A vending machine that dispenses snacks and drinks is set up in a school. A student approaches the vending machine and inserts a coin to buy a snack. The vending machine displays a list of available products, and the student selects their desired snack. The vending machine checks if the product is available and the student has sufficient funds, and then dispenses the snack. If the product is not available or the student does not have enough funds, the vending machine refunds the coins.
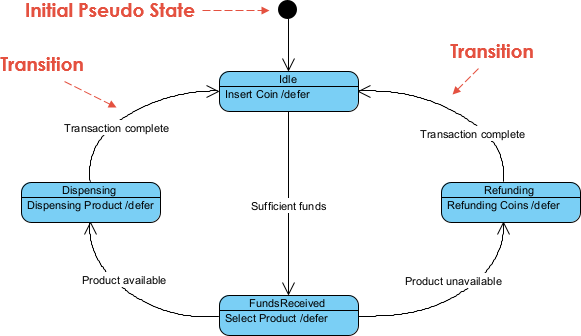
Modeling a Vending Machin by a State Chart
In this State Chart, the vending machine starts in the Idle state where the user can insert coins. If the user inserts sufficient funds, the vending machine transitions to the FundsReceived state where the user can select their product. If the selected product is available, the vending machine transitions to the Dispensing state to dispense the product and then returns to the Idle state once the transaction is complete. If the selected product is unavailable, the vending machine transitions to the Refunding state to refund the coins and then returns to the Idle state once the transaction is complete. If the user doesn’t insert sufficient funds, the vending machine transitions directly to the Refunding state to refund the coins and then returns to the Idle state once the transaction is complete.
Modeling a Vending Machin by an Activity Diagram
The given Activity Diagram represents the flow of events in a vending machine system. It starts with the start node, and the user is first required to insert coins. The diagram then shows an if condition to check if the user has inserted sufficient funds. If the funds are sufficient, the user is allowed to select a product.
The next if condition checks if the selected product is available. If the product is available, the vending machine dispenses the product, and the diagram shows a transition to the stop node, indicating that the transaction is complete. If the selected product is not available, the vending machine refunds the coins and then transitions to the stop node.
If the user does not insert sufficient funds, the vending machine directly refunds the coins and transitions to the stop node. In either case, the transaction is complete, and the user can collect their refund if applicable.
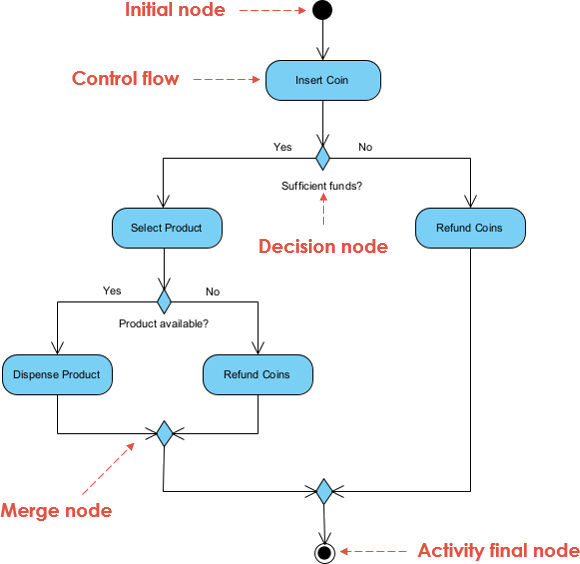
Overall, the Activity Diagram models a simple vending machine system with two possible outcomes – either the product is dispensed or the coins are refunded, depending on the availability of the selected product and the amount of funds inserted.
Summary
The two different types of diagrams in question here are State Charts and Activity Diagrams. Both of these are popular types of diagrams used in software engineering and system design.
- State Charts are used to represent the various states and state transitions of a system. They show the flow of control from one state to another, based on the events that occur in the system. State Charts are used to model the behavior of complex systems and to analyze the behavior of individual components within a system. They are especially useful in modeling reactive systems that respond to events, such as vending machines or traffic lights.
- Activity Diagrams, on the other hand, are used to model the flow of activities in a system. They show the sequence of activities that occur in a system, including decisions, loops, and branching. Activity Diagrams are used to model the business processes and workflows of a system, and to understand how the different components of the system interact with each other. They are especially useful in modeling systems that involve a series of activities, such as business processes, software algorithms, or manufacturing processes.
In terms of their use, State Charts are better suited for modeling reactive systems that respond to events, while Activity Diagrams are better suited for modeling systems that involve a sequence of activities. State Charts are useful in understanding the behavior of individual components within a system, while Activity Diagrams are useful in understanding the interactions between different components of a system. Ultimately, the choice of which diagram to use depends on the nature of the system being modeled and the purpose of the diagram.