


Capability-based planning is a business-focused approach to strategic planning that aims to deliver the required capabilities to an organization. It brings together all lines of business to achieve a shared goal, and is particularly useful in organizations where resources are involved in multiple capabilities, such as emergency preparedness units.
From an IT perspective, capability-based planning is highly relevant, especially when it comes to setting up a data center. This is because IT architects and planners are often involved in managing not just the IT implementation, but also other tasks such as personnel training and change management. In the past, many IT projects failed because these other tasks were not effectively controlled by Enterprise Architects and planners, despite the brilliance of the IT implementation itself.
Capability-based planning frames all phases of the architecture development in the context of business outcomes, linking the IT vision, architectures, and implementation plans with the corporate strategic, business, and line-of-business plans. This ensures that IT projects are described in terms of business outcomes, making it easier for businesses to appreciate what is being delivered, while helping IT architects to stay focused on the ultimate business goal.
In many governments, horizontal interoperability and shared services are emerging as cornerstones of e-Government implementations, while in the private sector, supply chain management and Service-Oriented Architecture (SOA) are driving planners and managers to govern both horizontally and vertically.
Concept of Capability-Based Planning
Capability-based planning is a crucial approach from both an Enterprise Architecture and IT perspective to ensure that the strategic business plan drives the enterprise. It allows for adaptability and innovation through capability engineering, leveraging both top-down and bottom-up approaches.
Regardless of how the corporation is structured, delivering business capabilities requires coordination and alignment across different business verticals. Ideally, capabilities should be business-driven and led, and the challenge is to ensure that the benefits are reaped at the enterprise level rather than just the line-of-business level. Projects within line-of-business-led portfolios tend to have a narrow perspective and can benefit from a corporate perspective.
SMART guidelines
Managing the delivery of a capability is challenging, but adopting a capability-based perspective within an organization can deliver synergistic business value that can ultimately lead to increased profitability and stock value. To ensure clarity and avoid ambiguity, it’s important to specify capabilities using the same discipline as in business scenarios, following the SMART guidelines.
The SMART guidelines help to ensure that objectives are specific, measurable, achievable, relevant, and time-bound, which can lead to greater clarity, motivation, and success in achieving organizational goals.
SMART is an acronym that stands for Specific, Measurable, Achievable, Relevant, and Time-bound. The SMART guidelines provide a framework for setting objectives that are clear, concise, and actionable.
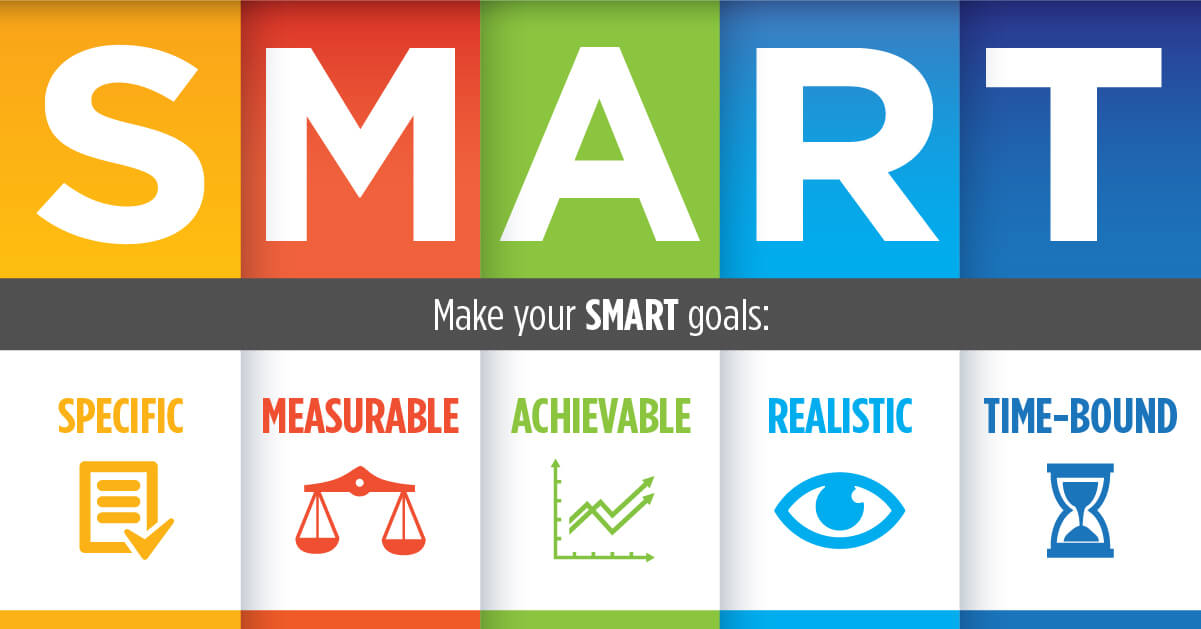
- Specific: Objectives should be specific and focused on a particular outcome or result. This helps to avoid ambiguity and ensures that everyone is clear on what needs to be achieved.
- Measurable: Objectives should be measurable so that progress can be tracked and success can be evaluated. This allows for adjustments to be made as needed and provides motivation for those working towards the objective.
- Achievable: Objectives should be achievable and realistic given the available resources and constraints. This ensures that the objective is attainable and does not lead to frustration or demotivation.
- Relevant: Objectives should be relevant and aligned with the organization’s overall strategy and goals. This helps to ensure that the objective contributes to the success of the organization as a whole.
- Time-bound: Objectives should be time-bound, with a specific deadline or timeframe for completion. This helps to ensure that progress is made within a reasonable timeframe and that the objective does not become a never-ending task.
Radar Charts for Capability Planning
Delivering a capability can be a lengthy process, varying depending on the organization and industry vertical. It typically involves multiple projects and increments to provide real business value to stakeholders, while also maintaining momentum towards the Target Architecture, executive support, and funding. To ensure successful delivery, capabilities should be broken down into increments that produce discrete, visible, and quantifiable outcomes, which serve as Critical Success Factors (CSFs) for continued capability support. Communicating these complex incremental changes to stakeholders is crucial for establishing buy-in at the start and maintaining it during the transition.
- Developing a capability is a long-term effort that involves multiple projects and incremental deliveries over an extended period of time.
- Breaking down the capability into smaller, manageable projects is essential to deliver real business value to stakeholders as soon as possible.
- The smaller projects should be designed with the overall capability in mind and aligned with enterprise architecture principles and standards.
- The specific timeline for capability development varies depending on the organization and industry vertical.
- Executive support and corporate funding are crucial for capability development.
- Effective communication and collaboration between enterprise architects, project managers, and business stakeholders are necessary for success.
What is a Radar Chart?
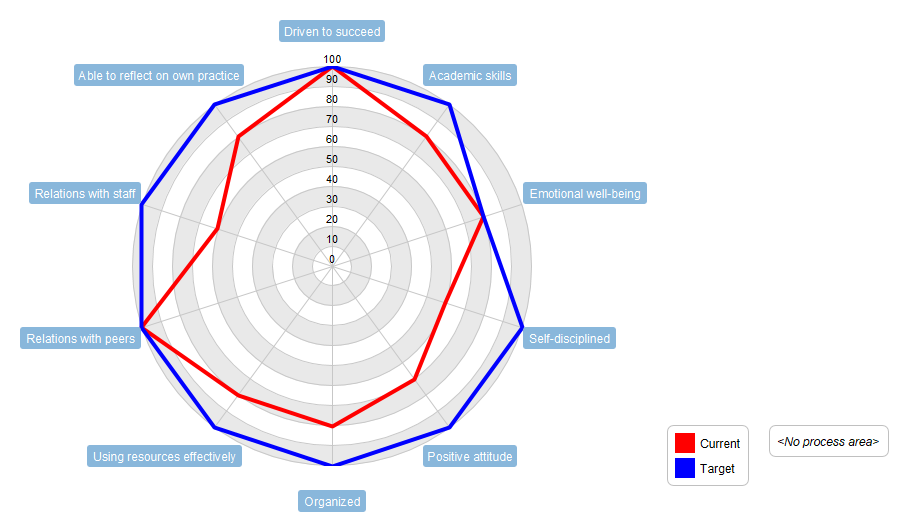
A Radar Chart, also known as a Spider Chart or Polar Chart, is a graphical representation that displays data in a two-dimensional format with multiple variables. It consists of a central point from which several axis lines extend, with each axis representing a different variable. The data is plotted on each axis line, and a shape is formed by connecting the data points. The resulting shape resembles a spider web or radar sweep, hence the name.
The Radar Chart is commonly used in business and marketing to compare different products or services based on various criteria, such as price, quality, features, and performance. It is also useful in capability planning to describe how a capability will evolve over time, as it can display the critical success factors (CSFs) and show the progress made towards achieving them.
In capability planning, a Capability Increment Radar diagram can be used to communicate the incremental evolution of a capability to stakeholders. The diagram shows the different increments of the capability along the axis lines and the progress made towards achieving each increment. The stakeholders can use the chart to understand how the capability will evolve over time and to monitor the progress made towards achieving the CSFs.
The Capability Increment “Radar” diagram, depicted in Figure below, is an effective tool for illustrating a capability’s evolution over time.
How to Create a Radar Chart for Capability Planning
Problem:
A company wants to grow its capabilities from its current state to a target state, but it doesn’t have a clear understanding of where it currently stands and what areas it needs to focus on to reach the target state. The company needs a tool to assess its current capabilities and identify gaps that need to be filled in order to achieve its growth objectives.
Solution:
To address this problem, the company can use a Radar Chart to visualize its current capabilities and compare them to its target state. A Radar Chart, also known as a Spider Chart or a Polar Chart, is a graphical tool used to display data in a circular format with multiple axes. Each axis represents a different dimension or capability, and the data is plotted as a series of points on each axis, forming a polygon.
The Radar Chart can be used to evaluate the company’s capabilities across several dimensions such as technology, process, skills, resources, and culture. The company can identify areas of strength and weakness and develop a roadmap to enhance its capabilities in the weaker areas.
For example, if the company wants to improve its technology capabilities, it can use the Radar Chart to assess its current state and identify areas for improvement such as upgrading its hardware and software, investing in new technologies, or hiring new talent with specialized skills. By using the Radar Chart, the company can prioritize its investments in areas that are most critical for achieving its growth objectives.
Let’s say a software development company wants to improve its capabilities in order to expand its business. The company has identified several key areas that it wants to focus on, including technology, process, skills, resources, and culture. The company wants to use a Radar Chart to assess its current state and develop a roadmap for growth.
The company conducts a survey of its employees to evaluate its capabilities across these dimensions. The results of the survey are as follows:
-
Dimension Current State Target State Actions to be Taken Technology 3 7 Invest in new hardware and software systems to improve efficiency and streamline processes. Develop an IT roadmap to guide technology investments. Process 4 8 Implement a continuous improvement program to identify and address inefficiencies. Develop standardized processes and procedures for key business functions. Skills 6 9 Develop a comprehensive training program to build employee skills and knowledge. Offer competitive salaries and benefits to attract and retain top talent. Resources 5 8 Conduct a resource audit to identify areas where resources can be optimized. Develop a resource allocation plan to ensure resources are used effectively. Culture 7 9 Develop a strong company culture that values innovation, collaboration, and continuous learning. Foster an inclusive work environment that values diversity and promotes employee engagement.
The table summarizes the current and target state for each dimension being evaluated and outlines specific actions that can be taken to improve capabilities in each area. By taking a comprehensive approach and addressing multiple dimensions simultaneously, organizations can create a roadmap for growth and work towards achieving their target state.
Based on these results, the company creates a Radar Chart using Echart.JS to visualize its current state:
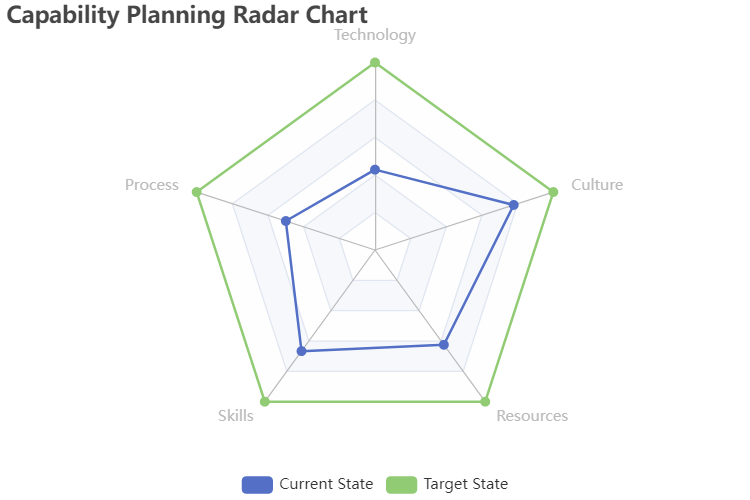
The Radar Chart shows two polygons, one representing the current state and the other representing the target state. The five axes represent the five dimensions being evaluated: Technology, Process, Skills, Resources, and Culture.
- The current state polygon is in blue
- The target state polygon is in green.
The chart shows that the company is currently strong in Skills but needs improvement in Process and Culture to reach its target state. By using this chart, the company can identify the areas that need the most attention and create a roadmap for growth.
Here a legend table with simple descriptions for each of the dimensions being evaluated in the Radar Chart:
| Dimension | Description |
|---|---|
| Technology | The company’s ability to leverage and utilize technology to support its business objectives. This includes hardware, software, and infrastructure. |
| Process | The company’s ability to effectively manage and optimize its processes for maximum efficiency and effectiveness. This includes processes related to product development, project management, and operations. |
| Skills | The company’s ability to attract, develop, and retain skilled and knowledgeable employees who can contribute to the company’s growth and success. |
| Resources | The company’s ability to effectively allocate and manage its resources, including financial resources, physical assets, and human capital. |
| Culture | The company’s ability to foster a positive and supportive work environment that promotes collaboration, innovation, and continuous learning. This includes values, beliefs, and behaviors that shape the company’s culture. |
This legend table provides a brief overview of each dimension being evaluated in the Radar Chart and helps viewers understand what each axis represents.
Summary
A Radar Chart can be a valuable tool for capability planning because it allows organizations to assess their current capabilities across multiple dimensions and create a roadmap for growth. By evaluating different dimensions such as technology, process, skills, resources, and culture, organizations can identify areas of strength and weakness and develop strategies to improve their capabilities.
A Radar Chart provides a visual representation of an organization’s current state and the target state, making it easier to identify areas that require attention. The chart allows organizations to see how different dimensions are interconnected and how improvements in one area can impact other areas. This holistic view enables organizations to develop a comprehensive plan that addresses multiple dimensions simultaneously.
Radar Charts can also be used to track progress over time by comparing current and target state charts. By regularly evaluating their capabilities and tracking progress, organizations can ensure that they are on track to achieve their goals.
Overall, a Radar Chart is a useful tool for capability planning because it provides a clear and concise view of an organization’s current and target state across multiple dimensions. This helps organizations develop a roadmap for growth and continuously monitor progress towards achieving their goals.