


The Migration Planning Techniques in TOGAF provide a structured approach to assessing and planning the implementation and migration of the Enterprise Architecture. By using these techniques, architects can ensure that the plans are comprehensive and aligned with the business objectives, while also taking into account the constraints and dependencies that may impact the implementation.
Each technique has its own specific purpose and can be used in different phases of the migration planning process. For example, the Implementation Factor Assessment and Deduction matrix can help to identify and document the factors that impact the implementation, while the Business Value Assessment Technique can help to assess the value and risks associated with different options.
By using these techniques in combination, architects can develop a holistic migration plan that takes into account all relevant factors and ensures a successful implementation of the Enterprise Architecture.
TOGAF ADM Implementation Factor Assessment and Deduction matrix
The TOGAF ADM Implementation Factor Assessment and Deduction matrix is a tool used to identify and evaluate factors that can impact the implementation of an enterprise architecture plan. The matrix typically includes three columns, which are:
- Factor: This column lists the various factors that can affect the implementation of the architecture plan. These factors can include Risks, Issues, Assumptions, Dependencies, Actions, Impacts, or any other relevant factor.
- Description: This column provides a brief description of each factor, explaining what it is and why it is important to consider when formulating the plan.
- Deductions: This column outlines the deductions that need to be made based on each factor. These deductions indicate the actions or constraints that must be taken into consideration when developing the implementation plan.
For example, let’s say that one of the factors listed in the matrix is “Risks.” In the description column, this factor might be defined as “potential negative events or situations that could impact the success of the implementation plan.” In the deductions column, the matrix might indicate that any identified risks should be evaluated and prioritized, and that appropriate risk mitigation strategies should be put in place.
Overall, the Implementation Factor Assessment and Deduction matrix is a useful tool for ensuring that all relevant factors are considered when developing an implementation plan, and that appropriate actions are taken to address any potential issues or constraints.
—
here’s a possible regeneration of the matrix based on the change to instant messaging:
| Factor | Description | Deductions |
|---|---|---|
| Change in Technology | ||
| Shutdown of message centers | Decision to close message centers and switch to instant messaging as the primary communication channel |
|
| Personnel | The people involved in implementing the plan and/or affected by the changes |
|
| Instant Messaging | The new technology being introduced as part of the implementation plan |
|
| Cost | The financial implications of the implementation plan |
|
Again, this is just one possible way to regenerate the matrix based on the updated technology, and the actual factors, descriptions, and deductions used in the matrix will depend on the specific business scenario being addressed.
Consolidated Gaps, Solutions, and Dependencies matrix
The Consolidated Gaps, Solutions, and Dependencies matrix is a technique used in the TOGAF architecture development process to identify and group gaps in the architecture domain, assess potential solutions, and dependencies to those gaps.
This technique helps architects prioritize their work and identify areas where solutions can have the most significant impact. By grouping gaps together, architects can better understand the relationships between them and identify solutions that address multiple gaps simultaneously.
The matrix is also useful for planning and creating work packages. The identified dependencies can help drive the creation of projects and inform migration planning in Phases E and F of the architecture development process. This ensures that projects are properly prioritized and aligned with business goals.
Overall, the Consolidated Gaps, Solutions, and Dependencies matrix is a valuable tool for architects to use throughout the architecture development process, enabling them to identify gaps, solutions, and dependencies, prioritize their work, and drive effective project planning and execution.
Example
here’s an example of how the Consolidated Gaps, Solutions, and Dependencies matrix could be used:
Let’s say that during the gap analysis phase of the architecture development process, the architecture team has identified several gaps in the current state architecture. These gaps include:
- Lack of a centralized data repository for customer data
- Inconsistent data definitions across business units
- Limited integration between CRM and order fulfillment systems
To create a Consolidated Gaps, Solutions, and Dependencies matrix, the architecture team would group these gaps together and assess potential solutions and dependencies. For example:
here’s the example again with numbering added in the first column:
| # | Gap | Potential Solutions | Dependencies |
|---|---|---|---|
| 1 | Lack of a centralized data repository for customer data | Implement a data lake for customer data | Dependent on resolution of inconsistent data definitions |
| 2 | Inconsistent data definitions across business units | Establish a data governance framework and common data model | Dependent on implementation of a data lake |
| 3 | Limited integration between CRM and order fulfillment systems | Implement an enterprise service bus (ESB) to enable real-time data exchange | Dependent on implementation of a data governance framework and common data model |
In this example, the matrix shows that addressing the gaps in customer data requires a multi-step approach that involves resolving data inconsistencies, implementing a data lake, establishing a data governance framework and common data model, and finally implementing an ESB to enable real-time data exchange.
This matrix can be used to plan work packages, identify dependencies, and prioritize projects in Phases E and F. For example, the architecture team could prioritize the implementation of the data governance framework and common data model as the first step in addressing the identified gaps, as it is a dependency for both the data lake and the ESB implementation.
Architecture Definition Increments Table
The Architecture Definition Increments Table is a technique used in The Open Group Architecture Framework (TOGAF) that allows architects to plan and track the development of an enterprise architecture over time. The table lists the different projects that will contribute to the development of the architecture, and assigns specific deliverables to each project that will be completed in increments over time.
The purpose of this table is to create a roadmap that outlines the planned sequence of Transition Architectures, which are intermediate states of the architecture that will be reached at specified times during the development process. Each Transition Architecture represents a stage of the architecture that is more complete and closer to the final state than the previous stage.
By breaking the development process down into incremental deliverables and assigning them to specific projects and timeframes, the Architecture Definition Increments Table helps architects to:
- Plan the development of the enterprise architecture in a structured and manageable way
- Ensure that each project is properly sequenced and that each increment is completed in a timely manner
- Identify potential dependencies and conflicts between different projects
- Provide a clear overview of the development process, which can be shared with stakeholders to ensure that everyone is aligned on the goals and timeline for the project.
Overall, the Architecture Definition Increments Table is a powerful tool that can help architects to manage complex enterprise architecture projects and ensure that they are completed successfully and on time.
Here is an updated Architecture Definition Increments Table that consolidates both the increment and start time information:
| Project Name | Increment 1 – Start Time | Increment 1 | Increment 2 – Start Time | Increment 2 | Increment 3 – Start Time | Increment 3 | Increment 4 – Start Time | Increment 4 |
|---|---|---|---|---|---|---|---|---|
| CRM System | Q1 2023 | Conceptual Architecture | Q2 2023 | Logical Architecture | Q3 2023 | Physical Architecture | Q4 2023 | Fully Operational System |
| Data Warehouse | Q1 2023 | Conceptual Architecture | Q2 2023 | Logical Architecture | Q3 2023 | Physical Architecture | Q4 2023 | Fully Operational System |
| E-Commerce Platform | Q2 2023 | Conceptual Architecture | Q3 2023 | Logical Architecture | Q4 2023 | Physical Architecture | Q1 2024 | Fully Operational System |
| Mobile Application | Q2 2023 | Conceptual Architecture | Q3 2023 | Logical Architecture | Q4 2023 | Physical Architecture | Q1 2024 | Fully Operational System |
In this updated table, each project has four increments, and each increment has a start time represented as a quarter and year. This allows the architect to plan a series of transition architectures and track progress towards achieving the fully operational system for each project.
For example, the CRM System project starts in Q1 2023, and each subsequent increment starts in the following quarter. The table shows that the Fully Operational System increment is scheduled for Q4 2023. This allows the architect to plan and track progress towards achieving the fully operational system for the CRM System project.
Similarly, the table shows the start times for each increment for the other three projects. This helps the architect to plan and track progress towards achieving the fully operational system for each project, and to identify potential conflicts or dependencies between different projects.
Transition Architecture State Evolution table
The Transition Architecture State Evolution table is a technique used in The Open Group Architecture Framework (TOGAF) to demonstrate the proposed state of an organization’s architectures at various levels using a defined taxonomy such as the TOGAF Technical Reference Model (TRM). This table is a visual tool that helps architects identify the services in the taxonomy that are used in the enterprise and then list the Transition Architectures and proposed transformations for those services.
The table should include a list of all the Solution Building Blocks (SBBs) and describe how they will impact and deliver on the services listed. The SBBs should also be marked to show how they will progress the Enterprise Architecture. For example, if a new capability is introduced, it will be marked as “new” or “retain” in the table. If a capability is being transitioned to a new solution, it will be marked as “transition.” And if a capability is being replaced, it will be marked as “replace.”
The Transition Architecture State Evolution table provides a clear picture of the changes that will occur in an organization’s architecture over time. It allows architects to see how their proposed changes will impact the organization’s services and how they will move the organization towards its target state. By using this table, architects can ensure that their proposed changes align with the organization’s goals and objectives and that they can be implemented effectively.
Example
Here is an example of what the Transition Architecture State Evolution table could look like based on the columns you mentioned:
| Sub-Domain | Service | Transition Architecture 1 | Transition Architecture 2 | Transition Architecture 3 |
|---|---|---|---|---|
| Sales | Order Management | Current State | Transition State | Target State |
| Sales | Customer Management | Current State | Transition State | Target State |
| Finance | Accounts Payable | Current State | Transition State | Target State |
| Finance | Accounts Receivable | Current State | Transition State | Target State |
| HR | Payroll | Current State | Transition State | Target State |
| HR | Benefits Administration | Current State | Transition State | Target State |
In this example, the first column lists the sub-domains within the organization, such as Sales, Finance, and HR. The second column lists the specific services within each sub-domain, such as Order Management, Accounts Payable, and Payroll. The remaining columns represent the various Transition Architectures, which could include the Current State, Transition State, and Target State.
Each cell in the table would then be filled out with the relevant information for that service and architecture. For example, the cell for Order Management and the Current State column might contain a description of the current architecture used to manage orders, while the cell for Order Management and the Target State column might describe the proposed architecture for managing orders in the future.
Business Value Assessment Technique
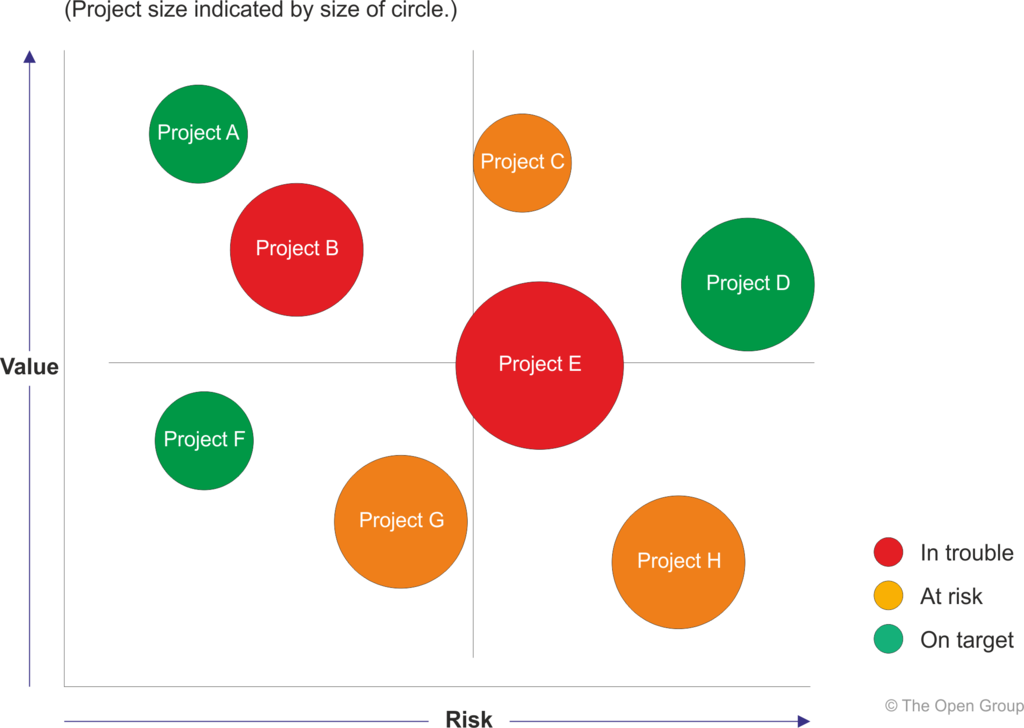
The business value assessment technique you described is a useful method to evaluate and prioritize various business initiatives or projects. By using a matrix with value and risk dimensions, businesses can evaluate their options based on objective criteria that align with their strategic goals and objectives.
The value index dimension, which includes compliance to principles, financial contribution, strategic alignment, and competitive position, helps to determine the potential benefits and opportunities that a project can bring to the business. The risk index dimension, which includes size and complexity, technology, organizational capacity, and impact of a failure, helps to identify potential risks and challenges that a project may face.
Example
By assigning individual weights to each criterion, businesses can determine the relative importance of each criterion in the decision-making process. This helps to ensure that the most critical factors are given more weight in the evaluation process.
Finally, it is important to establish the decision-making criteria before the options are known. This ensures that the evaluation process remains objective and consistent, and that all options are evaluated based on the same criteria. It also helps to prevent biases and personal preferences from influencing the decision-making process.