


Introduction
Unified Modeling Language (UML) is a powerful tool for visualizing and documenting software systems. Among the various UML diagrams, the Activity Diagram is a versatile and essential tool for modeling and describing the dynamic aspects of a system’s behavior. Whether you’re a software developer, system analyst, or project manager, understanding Activity Diagrams can significantly improve your ability to design and communicate complex processes within a system. In this article, we’ll explore what Activity Diagrams are, their components, and how to create and interpret them.
What is an Activity Diagram?
An Activity Diagram is one of the behavioral diagrams in UML, used to model the dynamic aspects of a system. It focuses on illustrating the workflow or sequence of activities, actions, and decisions within a system or a process. These diagrams are particularly useful for modeling business processes, software algorithms, and workflow scenarios, making them a valuable tool for software design, system analysis, and process optimization.
Benefits of Activity Diagrams
Activity Diagrams offer several benefits in the software development and system modeling process:
- Clarity: They provide a clear and intuitive visual representation of complex processes, making it easier for stakeholders to understand and discuss.
- Communication: Activity Diagrams serve as effective communication tools between different stakeholders, including developers, analysts, and project managers.
- Process Improvement: They help in identifying bottlenecks, inefficiencies, and areas for process improvement.
- Documentation: Activity Diagrams can be used as part of system documentation to explain how a process works.
- Validation: They allow for the validation of business and system processes before implementation.
Components of an Activity Diagram
To effectively use Activity Diagrams, it’s essential to understand their key components:
- Activity: An activity is a fundamental unit of work within an Activity Diagram. It represents a task, action, or operation that is performed as part of a process. Activities are usually depicted as rectangles with rounded corners.
- Initial Node: The initial node signifies the starting point of the activity diagram. It is typically represented as a small circle with an arrow pointing outward, connecting to the first activity.
- Final Node: The final node represents the endpoint of the activity diagram. It is depicted as a circle with a small dot inside or as a larger circle. It indicates the termination of the process.
- Control Flow: Control flow arrows, often referred to as control edges, connect activities and depict the sequence in which they are executed. These arrows show the order of execution, which helps in understanding the flow of the process.
- Decision Node: Decision nodes are represented as diamonds and are used to represent points in the process where a decision or branching occurs. Depending on the condition or criteria, the flow can follow different paths.
- Merge Node: Merge nodes, also represented as diamonds, are used to merge multiple flows back into a single flow after a decision or branching point. They ensure that multiple paths converge.
- Fork Node: Fork nodes represent the point at which one flow splits into multiple concurrent flows, indicating that multiple activities can happen simultaneously.
- Join Node: Join nodes represent the point at which multiple concurrent flows merge back into a single flow, indicating that parallel activities have completed.
- Swimlanes: Swimlanes are used to partition the activities in an Activity Diagram, typically to indicate which entity or actor is responsible for each task. They are represented as vertical or horizontal containers.
Creating an Activity Diagram
To create an Activity Diagram, follow these steps:
- Identify the Process: Clearly define the process you want to model. This may involve understanding the actors involved, the activities performed, and any decision points within the process.
- Identify Activities: Break down the process into individual activities or tasks that need to be represented in the diagram.
- Add Initial and Final Nodes: Place the initial node at the start of the diagram and the final node at the end.
- Connect Activities: Use control flow arrows to connect activities in the order they occur.
- Add Decision Nodes: If there are decision points in your process, add decision nodes (diamonds) and connect them with control flow arrows.
- Add Merge Nodes: For each decision node, add a corresponding merge node to show where the diverging paths rejoin.
- Use Fork and Join Nodes: If there are parallel activities in your process, add fork and join nodes to indicate the splitting and merging of flows.
- Partition with Swimlanes: If necessary, use swimlanes to partition activities by the responsible entity or actor.
- Label Activities: Add labels to activities and decision nodes to provide clear descriptions of what each represents.
- Specify Conditions: If applicable, include conditions or guards on control flow arrows to denote decision outcomes.
Interpreting an Activity Diagram
Interpreting an Activity Diagram involves understanding the sequence of activities, decision points, and the flow of control through the diagram. Here are some key points to consider:
- Follow the control flow arrows from the initial node to the final node to trace the sequence of activities.
- Pay attention to decision nodes; depending on the conditions specified, the flow can take different paths.
- Look for fork and join nodes to identify parallel activities and understand where they diverge and converge.
- Swimlanes help in identifying which entity or actor is responsible for each task.
- The labels on activities and decision nodes should provide clear descriptions of what each represents.
Activity Diagram Example
The diagram below illustrates a workflow detailing the various steps involved in processing an order at a theater box office. This process encompasses a branching decision and subsequent merging based on whether the order pertains to a subscription or individual tickets. Additionally, there is a forking mechanism that initiates concurrent activities that conceptually occur simultaneously, although their actual execution may or may not overlap. This concurrency is subsequently terminated by a matching join point.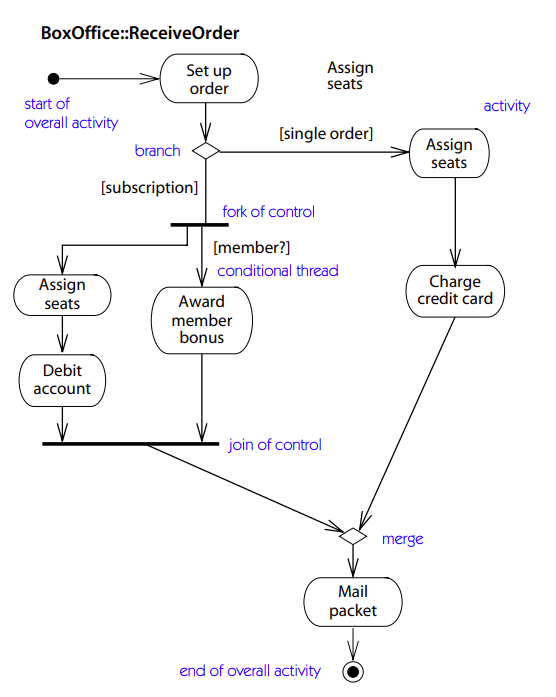
In cases where only one person is involved in the process, the concurrent activities can be executed in any order, presuming they cannot be performed simultaneously (though the model permits such simultaneous execution, it might be impractical in reality). For instance, theater box office personnel could either assign seats, then award bonuses, and finally debit the account, or they could start by awarding bonuses, then assigning seats, and lastly, debiting the account. However, it’s essential to note that debiting the account cannot occur until after the seats have been assigned.
Within this process, there is a conditional thread emerging from the fork point. This thread evaluates whether the subscriber is a member, serving as a guard condition. It only initiates if the guard condition is met. If the subscriber is not a member, only one thread is activated, responsible for seat assignment and account debiting, without waiting for synchronization at the join point.
Swimland Activity Diagram Example
The diagram presented below showcases a division of activities into three distinct partitions using swimlanes, each corresponding to different stakeholders involved in the process. Although UML doesn’t impose a requirement that these partitions align with objects, in this example, it’s evident that certain classes align neatly with each partition. These classes would typically be responsible for executing the operations associated with each activity in the final model.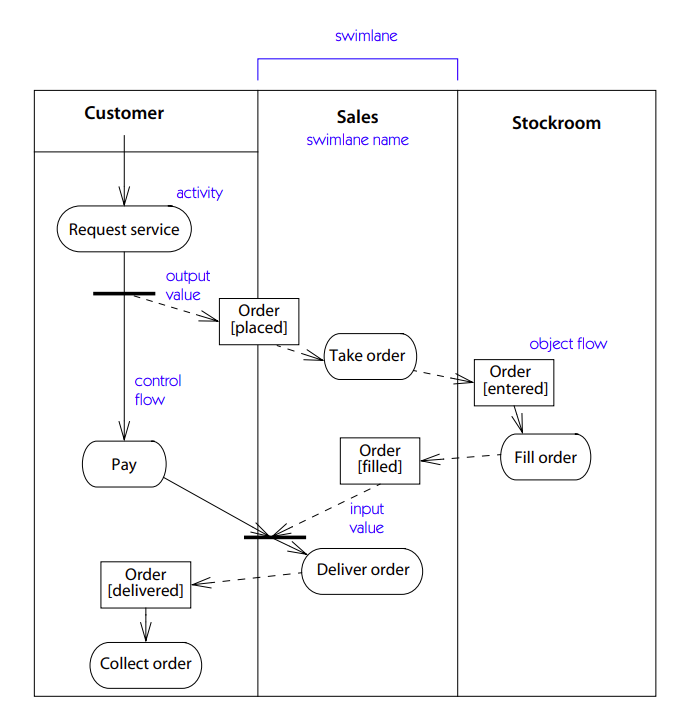
Furthermore, the diagram incorporates object flow symbols, which depict the different states of an “order” object as it traverses a network of activities. For instance, the “Order[placed]” symbol indicates that at that point in the computation, an order has transitioned to the “placed” state within the “Request Service” activity but has not yet been consumed by the “Take Order” activity. After the “Take Order” activity concludes, the order moves to the “entered” state, as evidenced by the object flow symbol following the “Take Order” activity. All the object flows in this instance represent the same object at different stages of its life. As they represent the same object, they cannot coexist simultaneously, and a sequential control path connects them, as evident in the diagram.
Object flow is employed to represent objects that serve as inputs to or outputs from an action. These symbols indicate the object’s state at the specific point in the computation when it is either suitable as an input or just produced as an output (typically, an object fulfills both roles). A dashed arrow links an outgoing transition of an activity state to an object flow, which constitutes one of its outputs. Conversely, another dashed arrow connects the object flow to an incoming transition into an activity state, indicating that the object serves as one of its inputs. Frequently, the same object can be both the output of one activity and the input for one or more subsequent activities.
Conclusion
Activity Diagrams in UML are powerful tools for modeling and visualizing dynamic aspects of a system or process. By understanding the components and principles of Activity Diagrams, you can effectively model complex workflows, improve communication among stakeholders, and optimize processes. Whether you’re involved in software development, business process analysis, or system design, Activity Diagrams can be a valuable addition to your toolkit, helping you create more efficient and well-documented systems.