


Introduction
Data-Flow Diagrams (DFDs) are powerful tools for modeling the flow of information within a system. They provide a visual representation that is accessible to both computer specialists and non-specialist users, making them invaluable during the analysis and specification of system requirements.
1. Basic Concept
At its core, a DFD models how information moves through a system and the activities that process this information. It is a graphical representation that fosters effective communication between software engineers, customers, and users.
2. Components of a DFD
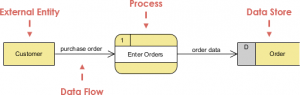
2.1 Processes
Processes in a DFD represent activities or transformations that take place within the system. These can range from simple operations to complex algorithms.
2.2 Data Stores
Data Stores are repositories where data is stored within the system. They could be databases, files, or any other form of storage.
2.3 Data Flows
Data Flows are arrows representing the movement of data between processes, data stores, and external entities. They illustrate how information travels within the system.
2.4 External Entities
External Entities are sources or destinations of information that exist outside the system but interact with it. These could be users, other systems, or even sensors.
3. Rules and Constructs
DFDs use a limited set of constructs and simple rules, making them easy to follow. The consistency in these rules across all data-flow diagrams ensures uniformity and clarity.
4. Benefits of DFDs
4.1 Collaboration
DFDs facilitate effective collaboration between software engineers, customers, and users. The visual nature of the diagrams simplifies complex concepts.
4.2 Analysis and Specification
They are instrumental in analyzing and specifying system requirements. By focusing on the flow of information, DFDs provide a clear understanding of how the system functions.
5. Step-by-Step Guide to Creating a DFD
5.1 Identify Processes
Begin by identifying the key processes in your system. These are the activities that manipulate or transform data.
5.2 Define Data Flows
Determine how data moves between processes. Use arrows to represent data flows and label them appropriately.
5.3 Introduce Data Stores
Identify where data is stored within the system. Connect data stores to processes and data flows accordingly.
5.4 Incorporate External Entities
Include external entities that interact with the system. Connect them to relevant processes through data flows.
5.5 Validate and Iterate
Review your DFD for accuracy and completeness. Iterate as needed, ensuring that the diagram effectively captures the information flow in the system.
6. Example
To solidify your understanding, let’s consider a simple example:
Scenario: Online Shopping System
- Processes: Order Processing, Inventory Management, Payment Processing.
- Data Flows: Order details flow from the customer to Order Processing, inventory updates flow to Inventory Management, and payment information flows to Payment Processing.
- Data Stores: Database for storing customer information, inventory database.
- External Entities: Customers placing orders.
Conclusion
Data-Flow Diagrams are a valuable tool in systems analysis. By following these steps, you can create a clear and comprehensive DFD that serves as a foundation for developing and understanding complex systems.