


Introduction
In the realm of software development, effective communication and collaboration are paramount. Developers, designers, and stakeholders must work together seamlessly to create robust and efficient software systems. One of the most powerful tools for visualizing and documenting these interactions is the sequence diagram. In this article, we will delve into the world of sequence diagrams, exploring their purpose, components, and best practices for creating them.
What is a Sequence Diagram?
A sequence diagram is a graphical representation of the interactions between various objects or components within a software system over a specific period. It provides a detailed view of how different elements communicate with each other to achieve a particular goal or perform a specific function. Sequence diagrams are a part of the Unified Modeling Language (UML) and serve as an indispensable tool for software developers, architects, and other stakeholders.
Components of a Sequence Diagram
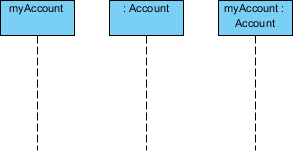
Lifelines: Lifelines represent the objects or entities that participate in the interaction. These can be classes, actors, or components. Each lifeline is depicted as a vertical dashed line, and they are positioned from top to bottom based on their involvement in the sequence.
Messages: Messages are the actions or interactions between lifelines. They are represented by arrows connecting the lifelines. Messages can be categorized into various types, such as synchronous, asynchronous, self-messages, and return messages, each conveying a different aspect of the interaction.
In the realm of sequence diagrams, the line types and arrowhead styles convey crucial information about the nature of the messages being utilized:
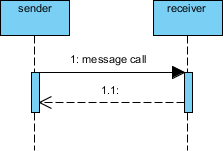
- Synchronous Messages (Typically Operation Calls)
- Representation: These messages are represented by a solid line with a filled arrowhead.
- Purpose: Synchronous messages denote regular communication between the sender and receiver, often signifying the invocation of operations or method calls within the system.
- Example:

- Return Messages
- Representation: Return messages are depicted using a dashed line with an open arrowhead.
- Purpose: These messages signify the return of control or information from the receiver to the sender. They typically follow a prior synchronous message.
- Example:
- Asynchronous Messages
-
- Representation: Asynchronous messages are illustrated as solid lines with an open arrowhead.
- Purpose: They represent messages sent without waiting for an immediate response. Asynchronous messages are often used to convey events or signals within the system.
- Example:

- Creation and Destruction Messages: Managing Participants
In the world of sequence diagrams, participants do not always persist throughout the entire duration of the interaction depicted. Instead, participants can be dynamically created and removed based on the messages exchanged during the sequence.
-
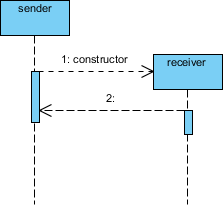
- Constructor Messages: Birth of Participants
- Creation: Constructor messages are responsible for generating a new participant, known as the receiver, within the sequence diagram.
- Placement: Participants that already exist at the onset of the interaction are positioned at the top of the diagram. In contrast, targets brought to life during the interaction through constructor calls are automatically placed further down the diagram.
- Constructor Messages: Birth of Participants
These constructor messages are instrumental in illustrating how new elements enter the sequence and become integral parts of the ongoing interaction, enriching the dynamic nature of sequence diagrams.
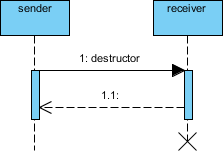
- Destructor Messages: The Farewell to Participants
In the realm of sequence diagrams, destructor messages serve the crucial role of removing or “destroying” a participant from the ongoing interaction. When a destructor message is invoked, it signifies the end of the participant’s involvement in the sequence.
However, it’s important to note that there are alternative methods to indicate the destruction of a target during an interaction. Destructor messages are specifically employed when the target’s destruction is set to ‘after destructor.’ In other words, destructor messages are necessary only when the removal of a participant occurs after the execution of the destructor message itself.
This approach allows for flexibility in representing the lifecycle of participants within a sequence diagram, accommodating scenarios where participants may exit the interaction at various points, ensuring a clear and adaptable visualization of the system’s behavior.
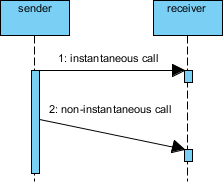
- Non-Instantaneous Messages: Timing Matters
In the domain of sequence diagrams, messages are typically treated as instantaneous, implying that they are transmitted and received almost instantaneously, with negligible delay. Such messages are represented by a straightforward horizontal arrow, suggesting swift communication between the sender and the receiver.
However, in certain scenarios, it becomes necessary to convey that there is a discernible time lag before the receiver actually receives the message. In such cases, a specialized visual cue is employed: a slanted arrow.
The slanted arrow effectively communicates that there is a notable delay in the delivery of the message to the receiver. This nuanced representation ensures that the timing aspect of the interaction is accurately depicted, enhancing the comprehensibility of the sequence diagram and providing a more precise reflection of the system’s temporal dynamics.
- Activation Bars: Activation bars or activation rectangles indicate the period during which a lifeline is actively engaged in the interaction. They appear as solid lines or rectangles extending from the lifeline’s vertical dashed line. Activation bars help visualize the duration of an object’s involvement in a particular interaction.
- Focus of Control: The focus of control arrow is a visual aid used to show which lifeline is currently in control of the interaction. It is particularly useful when depicting complex scenarios involving multiple lifelines.
- Iteration Notation: Repeating Messages
In the realm of sequence diagrams, iteration notation plays a pivotal role in illustrating the repetition of a message sent multiple times to various receiver objects. This notation is particularly useful when depicting scenarios involving the iteration over a collection of objects.
The essence of iteration notation lies in its ability to indicate the basis of the iteration within brackets. For example, you may use *[for all order lines] to signify that a specific message is sent iteratively to each element within the “order lines” collection.
By employing iteration notation in this manner, you can effectively convey the concept of iterating over a set of objects or elements, highlighting the repetitive nature of the message exchanges within the sequence diagram. This notation enhances the clarity and precision of the diagram, making it easier to comprehend complex interactions involving repeated actions.
Constraints and Comments: Sequence diagrams can include notes, constraints, and comments to provide additional information and context for better understanding.
Creating an Effective Sequence Diagram
To create an effective sequence diagram, consider the following best practices:
- Keep it Simple: Avoid unnecessary complexity. Focus on illustrating the key interactions and relationships without overwhelming the diagram with excessive detail.
- Use Descriptive Names: Ensure that the names of lifelines and messages are clear and descriptive. This helps anyone reviewing the diagram to understand the context easily.
- Group Related Interactions: Group related interactions together and use brackets or containers to visually represent these groups. This enhances the clarity of your diagram.
- Pay Attention to Sequence: The sequence of messages should accurately reflect the chronological order of interactions. This is crucial for understanding the flow of the system.
- Consider Alternate Paths: If your system has branching or alternate flows, use combined fragments (e.g., alt, opt, loop) to represent these scenarios within the sequence diagram.
Sequence Diagram: A step-by-step Example
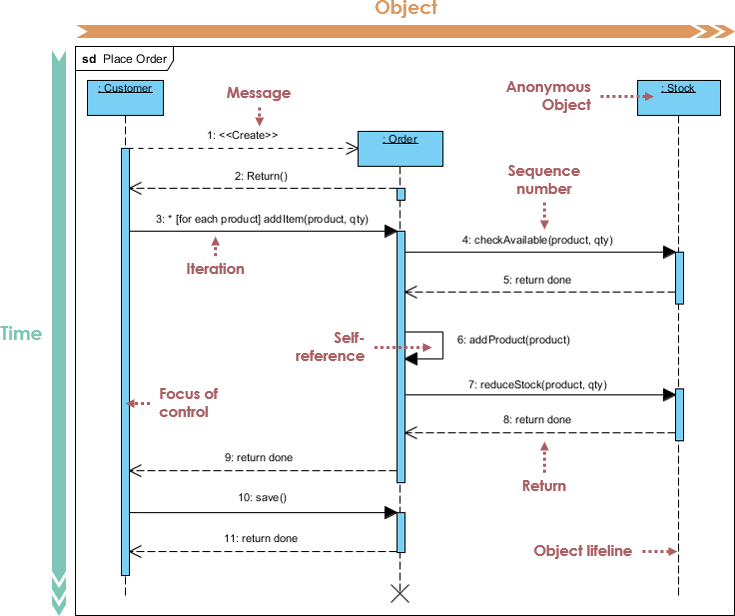
Example: Place Order – A Visual Sequence
In the context of a sequence diagram, let’s explore the “Place Order” scenario involving three key participants: Customer, Order, and Stock. Even without formal notation, you can intuitively grasp the unfolding narrative of this interaction:
Step 1 and 2: Customer Creates an Order
- The sequence begins with the Customer initiating the process by creating a new Order. This is indicated as the starting point.
Step 3: Customer Adds Items to the Order
- Following the order creation, the Customer proceeds to add items to the newly created Order, reflecting the customer’s product selection.
Step 4 and 5: Checking Inventory Availability
- Each item within the Order is then subjected to a verification process. Steps 4 and 5 represent the evaluation of product availability within the Stock.
Step 6, 7, 8: Adding Available Products to the Order
- Products deemed available, as determined in Steps 4 and 5, are then added to the Customer’s Order. This signifies successful product inclusion.
Step 9: Return
- At this point, there might be a return to the previous state or a continuation of the interaction, depending on the system’s logic and requirements.
Step 10 and 11: Saving and Destroying the Order
- In the final stages of this interaction, the system undertakes two critical actions: saving the Order (presumably for record-keeping) and then destroying the Order, possibly after it has been processed and fulfilled.
This “Place Order” sequence diagram visually narrates the flow of events and interactions between the Customer, Order, and Stock. It demonstrates how sequence diagrams serve as powerful tools for capturing the dynamics of real-world processes in a clear and intuitive manner.
Sequence Fragments: Visualizing Complexity in UML Sequence Diagrams
Within UML sequence diagrams, the concept of combined fragments serves as a powerful mechanism for illustrating complex scenarios involving loops, branches, and alternative paths. A combined fragment is essentially a container encompassing one or more interaction operands. These interaction operands, in turn, encapsulate various messages, interaction uses, or even additional combined fragments.
Representation of Sequence Fragments
In a sequence diagram, a sequence fragment is visually depicted as a box referred to as a “combined fragment.” This box envelops a specific portion of the interactions occurring within the sequence diagram, thus providing a clear boundary for the encapsulated interactions.
Fragment Operators: Defining the Nature of Interaction
At the heart of combined fragments lies the fragment operator, situated in the top-left corner of the fragment. This operator serves as a key indicator, specifying the type or nature of the fragment. The various fragment types at your disposal include:
- ref: Refers to an interaction defined on another diagram. It essentially references an external interaction, streamlining the representation of complex interactions within a sequence diagram.
- assert: Denotes an assertion or condition that must be satisfied within the enclosed interactions. It ensures that certain conditions are met during the sequence of events.
- loop: Indicates a loop, suggesting that the enclosed interactions should be iteratively executed a specified number of times. It embodies repetitive behavior within the sequence.
- break: Signifies a break in the sequence, often used to exit a loop or terminate a repetitive process prematurely.
- alt: Represents an alternative path or conditional branching. It allows you to depict multiple scenarios based on specific conditions or decisions.
- opt: Stands for “optional,” implying that the interactions within the fragment may or may not occur, contingent upon certain conditions.
- neg: Conveys a negative condition or an invalid interaction scenario. It highlights situations where certain interactions should not occur.
- sd: Represents a sequence diagram within a sequence diagram, allowing for a higher level of abstraction when dealing with complex interactions.
These fragment operators empower you to accurately depict intricate sequences of events, decision points, and loops within your UML sequence diagrams. They are invaluable for modeling real-world processes and system behaviors with precision and clarity.
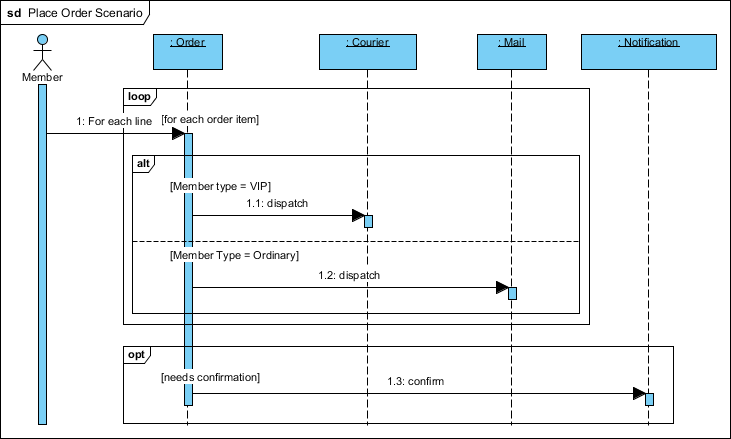
Example: Place Order Scenario – Visualizing Complex Interactions
In this illustrative example of a sequence diagram, we’ll delve into the process of a member placing an order online. The scenario entails various interactions and conditions, including the choice of delivery method and optional confirmation notifications. Through this sequence diagram, we aim to provide a clear representation of the intricacies involved:
1. Initialization:
- The sequence begins with the initiation of the online order process by the member.
2. Creating an Order:
- The member proceeds to create an order within the system.
3. Selecting Delivery Method:
- A decision point arises as the member selects the preferred delivery method. This decision depends on the member’s status, which can be either VIP or Ordinary.
4. VIP Member Path:
- If the member is classified as VIP, the system directs the order to be sent via courier, as indicated by the “Courier” message.
5. Ordinary Member Path:
- Conversely, for an ordinary member, the system opts for ordinary mail delivery, as depicted by the “Ordinary Mail” message.
6. Optional Notification Check:
- The sequence then checks if the member has opted for a confirmation notification. This represents an optional feature based on the member’s choice during the order process.
7. Sending Notification:
- If the member has indeed opted for a notification, the system proceeds to send a confirmation notification to the member.
8. Order Completion:
- The sequence culminates with the successful completion of the order process, signifying that the member’s request has been processed and their order will be delivered according to their status and preferences.
Through this sequence diagram, the complex interactions involved in the “Place Order” scenario are effectively visualized. It highlights decision points, conditionality based on member status, and the optional nature of notification, allowing for a comprehensive understanding of the online ordering process.
Conclusion
Sequence diagrams are a vital tool in the software development process, enabling teams to visualize and document complex interactions within a system. By adhering to best practices and creating clear, concise diagrams, software professionals can enhance their communication, improve system design, and streamline the development process. With a well-constructed sequence diagram, stakeholders can gain a deeper understanding of a software system’s behavior and ensure that everyone is on the same page when it comes to system interactions.