


Introduction
In the intricate world of system analysis and design, clarity is paramount. Enter Data Flow Diagrams (DFD) and the art of functional decomposition—powerful tools that unravel the complexity of systems, guiding us through the intricate dance of data.
This article embarks on a journey to demystify these concepts, exploring how they interweave to provide a holistic understanding of system functionality. From the bird’s-eye view of the context diagram to the granular details of subsequent DFD levels, we navigate the landscape of structured analysis to design modular and scalable systems.
Understanding Data Flow Diagrams (DFD):
Data Flow Diagrams are a visual representation of how data flows through a system, illustrating the processes, data stores, data sources, and data destinations. They provide a clear and concise way to understand the functionality of a system and how information moves within it.
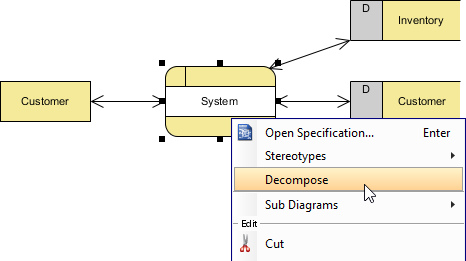
Functional Decomposition:
Functional decomposition is the process of breaking down a complex system into smaller, more manageable sub-systems or functions. It helps in understanding the system’s structure and hierarchy, making it easier to analyze and design.
Levels of DFD:
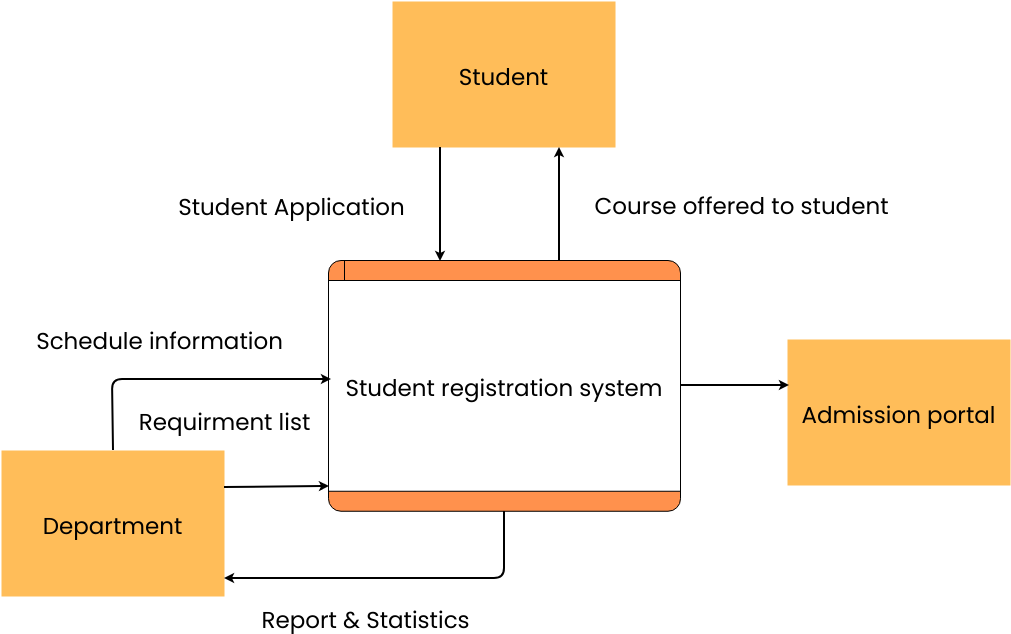
- Context Diagram:
- Purpose: The context diagram provides a high-level view of the entire system. It shows the system as a single process and external entities that interact with it. This diagram is crucial for understanding the system’s boundaries and the flow of data into and out of the system.
- How it’s done: Start with a rectangle representing the entire system (the process) and label it. Then, identify external entities (sources or destinations of data) and connect them to the system with arrows representing data flow.
- Advantages: The context diagram simplifies complex systems, making them easier to comprehend. It’s a valuable communication tool between stakeholders, helping them understand the system’s interactions without getting into the nitty-gritty details.
- Level 1 DFD:
- Purpose: The Level 1 DFD delves deeper into the system, breaking down the main process into major sub-processes. It provides a more detailed view of how data flows within the system.
- How it’s done: Take the main process from the context diagram and decompose it into its major sub-processes. Connect these sub-processes with arrows representing data flow. External entities remain at this level, interacting with the main and sub-processes.
- Advantages: Level 1 DFD helps in understanding the major functions of the system and their interrelationships. It sets the stage for further decomposition into more detailed levels.
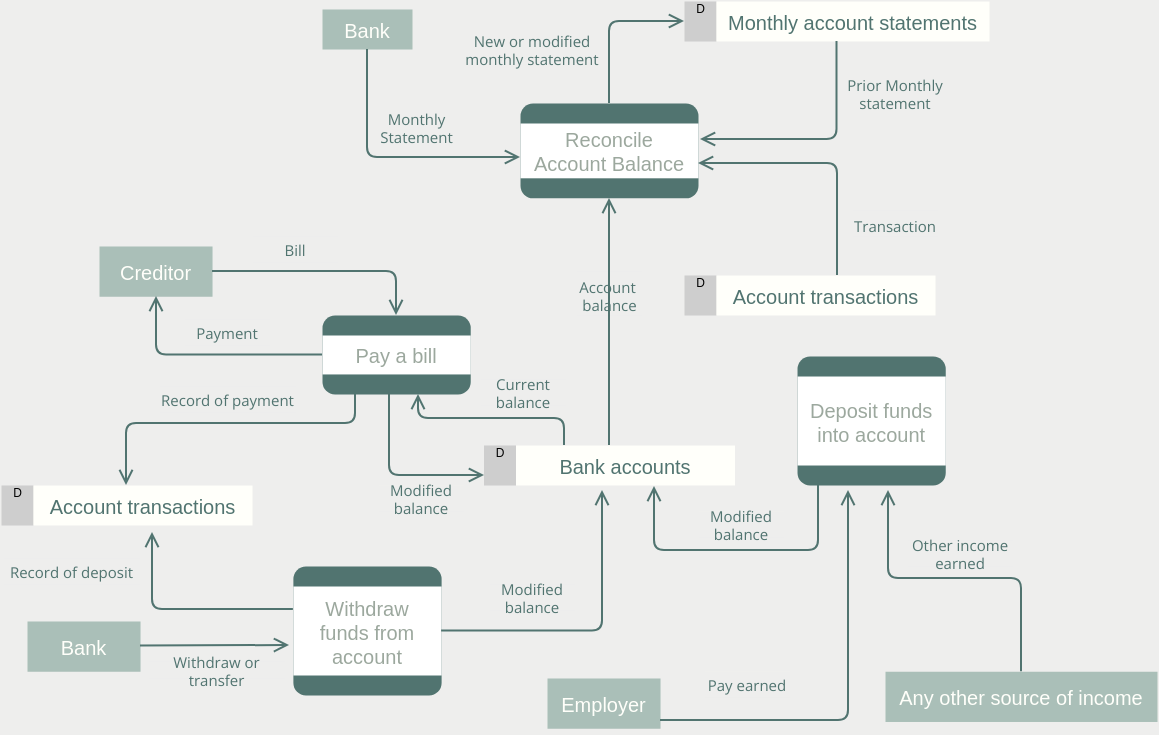
- Subsequent Levels of DFD:
- Purpose: Continue decomposing each sub-process from the Level 1 DFD into more detailed sub-processes until a satisfactory level of detail is achieved. Each subsequent level provides a more granular view of the system.
- How it’s done: Take each sub-process from the previous level and decompose it further. Repeat this process until reaching a level where each sub-process is easily understandable and manageable.
- Advantages: The detailed levels help in designing and implementing each specific function. It facilitates a systematic approach to understanding and managing the complexity of a system.
Advantages of DFD and Functional Decomposition:
- Clarity:
- DFDs provide a clear and concise visual representation of how data moves within a system, making it easier for stakeholders to understand the system’s functionality.
- Hierarchy:
- Functional decomposition establishes a hierarchy of functions, breaking down a complex system into manageable and understandable components.
- Communication:
- DFDs serve as a powerful communication tool between technical and non-technical stakeholders. They offer a common language to discuss and understand the system.
- System Design:
- Functional decomposition guides the system design process by breaking down the overall system into smaller, more manageable parts. It aids in the development of modular and scalable systems.
Data Flow Diagrams and functional decomposition are invaluable tools in systems analysis and design. They provide a structured and visual approach to understanding, designing, and communicating the complexities of systems. The hierarchical nature of DFDs and the step-by-step breakdown through functional decomposition contribute to the success of system development projects.
Streamlining Systems: Unleashing the Power of Visual Paradigm’s Data Flow Diagram Tool
Navigating the intricate channels of information flow within a system demands precision and clarity. Enter the world of Data Flow Diagrams (DFD), where the complex dance of data is visualized and harnessed for effective system analysis and design. In this technological era, the need for an intuitive and robust DFD tool is paramount. Visual Paradigm emerges as a beacon in this space, offering an easy-to-use DFD editor that empowers users to craft detailed and insightful representations of information flow within their systems.
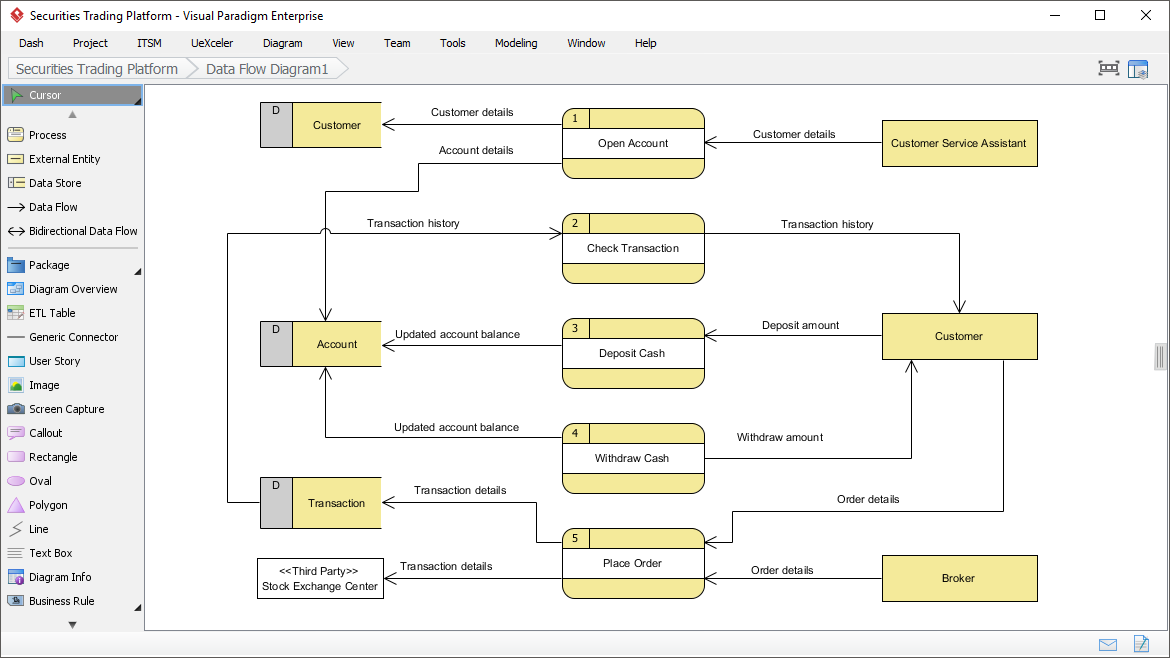
Features of Visual Paradigm’s DFD Tool:
- Easy-to-Use Editor:
- Visual Paradigm’s DFD tool is designed with user-friendliness in mind. The easy-to-use editor allows both novice and experienced users to seamlessly create intricate Data Flow Diagrams.
- Precision in Modeling:
- Achieve precision in your DFDs with drag-and-drop shape creation and precise shape positioning aided by alignment guides. This ensures that your diagrams are not just informative but visually appealing.
- Element Reusability:
- Efficiency is key, and Visual Paradigm understands that. The tool allows for the reuse of elements, saving valuable time and effort in the modeling process.
Creating DFDs with Visual Paradigm:
- Identifying Information Flow:
- DFDs enable users to identify the flow of information within a system. This includes understanding the input and output of information for specific entities or sub-processes within a defined system or process scope.
- Information Requirements:
- Visual Paradigm’s DFD tool facilitates a detailed exploration of the kind and form of information required to complete a particular process. This level of insight is crucial for effective decision-making and system optimization.
Visual Paradigm’s DFD tool stands out as a powerhouse. Its features, from drag-and-drop simplicity to precise modeling capabilities, empower users to craft DFDs that not only elucidate the intricacies of information flow but also serve as invaluable assets for presentations and reports. When efficiency meets precision, the result is a seamless journey through the complex landscape of system understanding, and Visual Paradigm’s DFD tool is the compass guiding the way.
Summary
In the realm of systems, clarity is not a luxury but a necessity. Data Flow Diagrams, with their hierarchical structure, and functional decomposition, with its systematic breakdown of functions, emerge as beacons of understanding.
The context diagram sets the stage, revealing the system’s boundaries and interactions. As we descend into Level 1 DFD and subsequent levels, the granularity increases, providing a roadmap for system design. The advantages are manifold—clarity, hierarchy, effective communication, and a blueprint for system development. Together, DFD and functional decomposition unlock the doors to comprehending and managing the intricacies of systems, ensuring a structured and informed approach to system analysis and design.