


Developing new products can be a complex and challenging process, requiring careful consideration of a variety of factors, including product features, resource allocation, customer needs, revenue generation, and decision-making. To ensure that the development process is as effective and efficient as possible, it’s important to use tools that can help to evaluate and compare different options, prioritize key features, and identify actionable steps to drive progress towards the desired outcome. In this article, we will explore how the use of radar charts and action plans can help to streamline the product development process and ensure that all stakeholders are aligned and working towards a common goal.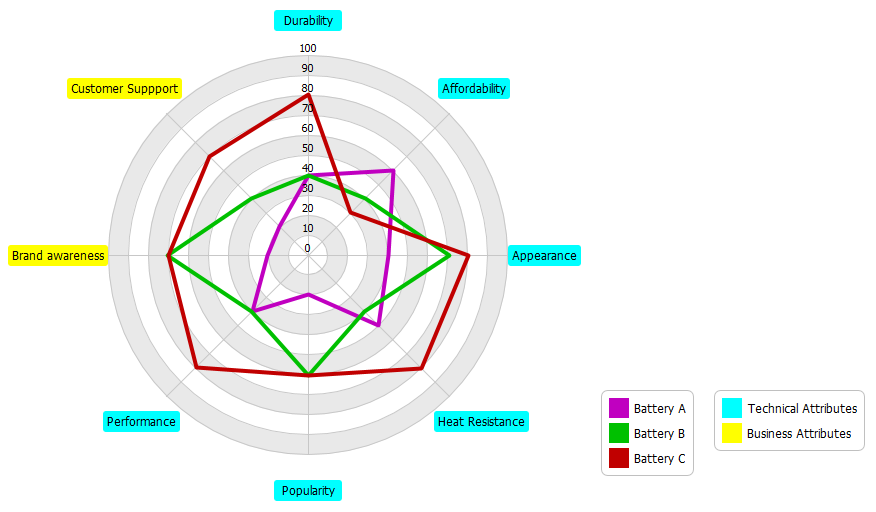
Utilizing Radar Charts for Effective Product Development
Radar charts are particularly relevant to product development because they provide a visual representation of key criteria, allowing teams to quickly evaluate and compare different options. In product development, there are often a wide range of factors to consider, including product features, resource allocation, customer needs, revenue generation, and decision-making. By using a radar chart, product development teams can clearly see where each product or feature stands in relation to these key criteria, and identify areas where improvements are needed.
One of the key benefits of using a radar chart in product development is that it helps to prioritize key features. By assigning values to each criteria, teams can see which features are most important and where improvements are needed. This can help teams to make informed decisions about what to prioritize in the product development process, and ensure that they are focusing on the most critical features.
Radar charts are also useful for identifying areas where further analysis and improvement is needed. By highlighting the gap between the current state and target state for each criteria, teams can identify areas where additional work is needed to improve the product or feature. This can help to drive progress towards the desired outcome, and ensure that teams are continually making improvements to the product.
Overall, radar charts are a powerful tool for product development teams, helping to evaluate and compare different options, prioritize key features, and identify areas for improvement. By using radar charts in conjunction with other tools, such as action plans, product development teams can ensure that they are making informed decisions and driving progress towards their desired outcome.
Example
Let’s explore a practical example to demonstrate how radar charts can be used to enhance the product development process.
The problem that companies often face during the product development stage is determining which features and characteristics to prioritize in order to create a product that meets customer needs and generates revenue. Without a clear understanding of what features are most important, companies risk wasting resources on developing features that may not be valued by their target audience.
Traditional methods of product analysis may not provide a clear and comprehensive overview of the various features and characteristics that make up a product. This can lead to a lack of insight into how different features compare and which ones should be prioritized.
Radar charts offer a solution to this problem by providing a visual representation of the key features and characteristics of a product, allowing companies to easily evaluate and compare different products. By using radar charts to analyze product features, companies can make informed decisions on which features to prioritize and which ones to de-prioritize, ultimately leading to a more successful product launch.
Collect and Summary Data in A table Form
| Criteria | Current State | Target State | GAP (Current – Target) |
|---|---|---|---|
| Product Features | Features have not been fully evaluated and compared | Features have been evaluated and compared using radar charts | Significant GAP between current and target state |
| Resource Allocation | Resources are being allocated without a clear understanding of feature prioritization | Resources are being allocated based on radar chart analysis | Significant GAP between current and target state |
| Customer Needs | Customer needs are not being fully met due to unclear feature prioritization | Customer needs are being addressed through prioritized feature development | Significant GAP between current and target state |
| Revenue Generation | Revenue generation is impacted by the lack of clear feature prioritization | Revenue generation is improved through prioritized feature development | Significant GAP between current and target state |
| Decision-making | Decisions are being made without comprehensive product feature analysis | Decisions are being made based on radar chart analysis | Significant GAP between current and target state |
Assign the Current and Target State with Same Scale
Assigning a numerical value to the Current State and Target State of each criteria on a scale of 1-10 helps to provide a more standardized and quantitative measure of the current and desired states. This makes it easier to compare and analyze the different criteria, and to identify areas where improvements can be made.
To assign the scale values to the Criteria in the table, we first need to determine what scale is appropriate for each criteria. In general, the scale should be selected based on the nature of the criteria being evaluated. For example, criteria that involve time or speed (such as response time) may have a smaller-is-better scale, while criteria that involve revenue or customer satisfaction may have a larger-is-better scale.
Once we have selected an appropriate scale for each criteria, we can assign a numerical value from 1-10 to the Current State and Target State based on their relative position on the scale. For example, if we are using a larger-is-better scale for Revenue Generation, a Current State of 3 might represent low revenue generation, while a Target State of 8 might represent high revenue generation.
The updated table with Current State and Target State values on a scale of 1-10 can then be used to create a radar chart. The radar chart should be constructed with the same scale for each criteria to ensure accurate comparison across criteria. The distance from the center of the chart to the data point for each criteria represents its value on the scale. The radar chart can then be used to visualize the Current State and Target State for each criteria, as well as to identify areas where there is significant room for improvement based on the GAP values.
| Criteria | Current State | Target State | GAP |
|---|---|---|---|
| Product Features | 3 | 8 | -5 |
| Resource Allocation | 4 | 9 | -5 |
| Customer Needs | 2 | 9 | -7 |
| Revenue Generation | 3 | 8 | -5 |
| Decision-making | 4 | 9 | -5 |
Note: The scale ranges from 1 (low) to 10 (high) for both Current State and Target State, where a higher number represents a better state. The GAP is calculated as the Target State minus the Current State. A negative GAP indicates that there is room for improvement.
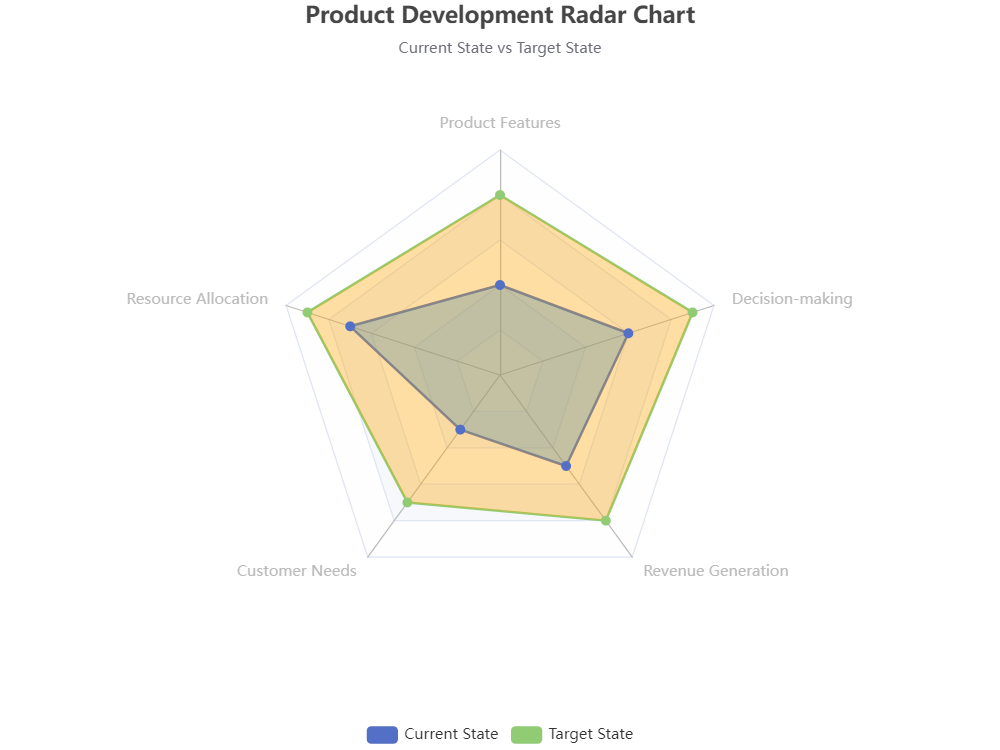
This updated table can be used for radar chart analysis by plotting the Current State and Target State values for each criteria on a radar chart, with the distance from the center representing the value on the scale. The radar chart can then be used to visually compare the Current State and Target State for each criteria, as well as to identify areas where there is significant room for improvement (indicated by a large negative GAP).
Draw the Radar Chart with the Analyzed Data
Identify Actions to be Taken
Adding an additional column for “Action Planned” to the above table can help to identify what steps need to be taken in order to bridge the gap between the current state and the target state for each criterion. It allows for a more actionable and practical approach to improving product development.
The “Action Planned” column can include specific steps or strategies that the company plans to implement in order to achieve the target state for each criterion. For example, if the “Resource Allocation” criterion has a gap between the current state and target state, the “Action Planned” column could include steps such as reallocating resources, optimizing workflows, or improving communication among team members.
Here is an example of the updated table with the additional “Action Planned” column:
| Criteria | Current State | Target State | GAP | Action Planned |
|---|---|---|---|---|
| Product Features | 3 | 8 | -5 | Conduct customer research to gather feedback and prioritize feature development accordingly |
| Resource Allocation | 4 | 9 | -5 | Reallocate resources to improve efficiency and reduce waste |
| Customer Needs | 2 | 9 | -7 | Conduct surveys and focus groups to better understand customer needs and preferences |
| Revenue Generation | 3 | 8 | -5 | Implement targeted marketing strategies and explore new revenue streams |
| Decision-making | 4 | 9 | -5 | Establish clear decision-making processes and communication channels among team members |
Adding a column for “Stakeholders Involved” can help to provide additional context and information about who is impacted by the criteria being evaluated. It can also help to ensure that the needs and perspectives of all stakeholders are taken into account in decision-making.
For example, if the criteria being evaluated is “Product Features,” stakeholders involved may include customers, product managers, designers, and developers. Each of these stakeholders may have different priorities and perspectives when it comes to product features, so understanding their input and involvement can help to prioritize and develop features that meet their needs and expectations.
Here is the updated table with the new column:
| Criteria | Current State | Target State | GAP | Action Planned | Stakeholders Involved |
|---|---|---|---|---|---|
| Product Features | 3 | 8 | -5 | Conduct customer research to gather feedback and prioritize feature development accordingly | Customers, product managers, designers, developers |
| Resource Allocation | 4 | 9 | -5 | Reallocate resources to improve efficiency and reduce waste | Project managers, team leads, financial analysts |
| Customer Needs | 2 | 9 | -7 | Conduct surveys and focus groups to better understand customer needs and preferences | Marketing team, customer service representatives, product managers |
| Revenue Generation | 3 | 8 | -5 | Implement targeted marketing strategies and explore new revenue streams | Sales team, marketing team, financial analysts |
| Decision-making | 4 | 9 | -5 | Establish clear decision-making processes and communication channels among team members | Project managers, team leads, executives |
Elaborating on the first criteria with an Action Plan table can provide a more detailed and actionable plan for addressing the gap between the current state and target state. It can help to ensure that specific actions are identified and assigned to responsible parties, with clear timelines and resource requirements, to drive progress towards the target state.
For example, if the first criteria is “Product Features” and the gap is that the current state is a 3 and the target state is an 8, an Action Plan table can help to identify specific actions that can be taken to improve the product features and close the gap. This can include conducting customer research to gather feedback, prioritizing feature development based on customer needs, and assigning specific team members to lead the development of each feature.
Here is an example of an Action Plan table for the “Product Features” criteria:
| Action Item | Responsible Party | Timeline | Resources Required |
|---|---|---|---|
| Conduct customer research to gather feedback on current product features | Marketing team, product managers | Q2 2023 | Customer survey tool, focus group facilitator |
| Prioritize feature development based on customer needs and feedback | Product managers, development team | Q3 2023 | Product management software, project management software |
| Assign specific team members to lead development of each feature | Development team | Q4 2023 | Project management software |
| Conduct usability testing on new features to ensure they meet customer needs | Design team, development team | Q4 2023 – Q1 2024 | Usability testing software, user research participants |
Overall, an Action Plan table can help to break down a larger goal into specific, actionable tasks that can be assigned to responsible parties with clear timelines and resource requirements. This can help to drive progress towards the target state and ensure that all stakeholders are aligned and working towards a common goal.
Summary
Radar charts are a powerful tool for evaluating and comparing different products and features, providing a visual representation of key criteria and highlighting areas where improvements are needed. To use radar charts effectively, it’s important to assign values on a consistent scale, such as a 1-10 rating system, and to clearly define the current state, target state, and gap for each criteria. To turn these insights into actionable steps, an action plan table can be used, breaking down larger goals into specific tasks that can be assigned to responsible parties with clear timelines and resource requirements. By using these tools together, product development teams can ensure that they are making informed decisions, prioritizing key features, and driving progress towards their desired outcome.