


Using Radar Charts for Capability-Based Planning
Radar charts, also known as spider charts or star charts, can be useful for capability-based planning in The Open Group Architecture Framework (TOGAF). Capability-based planning involves identifying an organization’s capabilities and determining how those capabilities can be improved to achieve the organization’s goals.
Radar charts can help with this process by visually representing an organization’s capabilities and their current level of performance. The chart consists of a series of axes that represent different capability areas, such as technology, people, processes, and information. Each axis is divided into sections that represent different levels of performance, such as low, medium, and high.
To use radar charts for capability-based planning in TOGAF, an organization can follow these steps:
- Identify the capability areas that are important for achieving the organization’s goals.
- Determine the performance levels for each capability area, based on factors such as current performance, future goals, and industry standards.
- Plot the performance levels for each capability area on the radar chart, using the appropriate axis and section.
- Analyze the chart to identify areas where performance is low and improvements are needed.
- Use the chart to guide the development of a capability improvement plan, including actions to be taken, resources needed, and timelines.
By using radar charts in capability-based planning, organizations can better understand their current capabilities and identify areas for improvement. This can lead to more effective planning and execution of capability improvements, ultimately helping the organization achieve its goals.
Problem Description
Our organization is experiencing low customer satisfaction levels and high rates of customer churn. We need to identify the areas of our business that are contributing to these issues and develop a plan to improve our customer experience. To do this, we want to conduct a Radar Chart analysis of our customer-facing capabilities, including our website, customer service, product quality, and pricing. By visualizing the current performance levels of each capability area and identifying areas for improvement, we hope to develop a comprehensive improvement plan that will address our customer satisfaction and retention issues.
Develop a Capability Improvement Plan for IT Operations
Title: Capability Improvement Plan for IT Operations
| Dominion | Current State | Target State | Gap | Action to be Taken |
|---|---|---|---|---|
| Process | Manual, ad-hoc processes with inconsistent results | Standardized, automated processes with measurable outcomes | Large | Implement ITIL-based processes and tools; train staff on new processes |
| Technology | Legacy systems with limited integration capabilities | Modern, integrated systems with flexible APIs | Medium | Migrate to cloud-based platforms; invest in integration middleware |
| People | Siloed teams with limited communication and collaboration | Cross-functional teams with shared goals and clear communication channels | Small | Implement Agile methodologies; foster a culture of collaboration and knowledge sharing |
| Information | Disparate data sources with inconsistent quality | Centralized, well-governed data repository with high data quality | Large | Implement data governance framework; invest in data quality tools and resources |
| Performance | Reactive and firefighting approach to incident management | Proactive and preventive approach with predictive analytics | Large | Implement IT Operations Analytics (ITOA) tool; train staff on proactive incident management approach |
Note: This is just an example of how the table could look like. The actual values and actions may vary depending on the specific organization and its goals.
A Radar Chart for Capability-Based Planning
The values in this table are on a scale of 1-10, with 1 being the lowest performance level and 10 being the highest. These values are based on the information provided in the Capability Improvement Plan for IT Operations table. The radar chart can be created using these values to visually represent the current and target performance levels of each capability area.
Here’s an example of a radar chart table based on the information provided in the Capability Improvement Plan for IT Operations table:
| Capability Area | Current State | Target State |
|---|---|---|
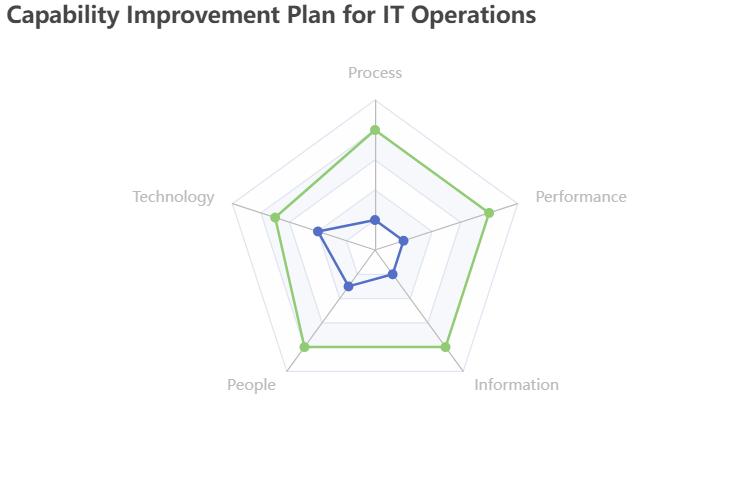
| Process | 2 | 8 |
| Technology | 4 | 7 |
| People | 3 | 8 |
| Information | 2 | 8 |
| Performance | 2 | 8 |
Here is a radar chart that displays the current and target performance levels for each capability area in the Capability Improvement Plan for IT Operations.
Reviews and Action Plan
We need to review and add actions to be taken based on the capability assessment in order to improve the performance of the organization in the identified areas. The capability assessment helps to identify the strengths and weaknesses of the organization in relation to its goals and objectives. By reviewing the results of the assessment and identifying the gaps between the current state and the desired target state, we can determine the necessary actions that need to be taken to improve the performance of the organization in the identified areas.
Adding the “Action to be Taken” column to the capability assessment table helps to clearly identify the recommended actions that need to be taken in order to address the identified gaps. This column provides a roadmap for improvement and helps to ensure that the necessary steps are taken to improve the performance of the organization in the identified areas.
Here’s an updated version of the table with an “Action to be Taken” column added:
| Capability Area | Current State | Target State | Action to be Taken |
|---|---|---|---|
| Process | 2 | 8 | Implement ITIL-based processes and tools; train staff on new processes |
| Technology | 4 | 7 | Migrate to cloud-based platforms; invest in integration middleware |
| People | 3 | 8 | Implement Agile methodologies; foster a culture of collaboration and knowledge sharing |
| Information | 2 | 8 | Implement data governance framework; invest in data quality tools and resources |
| Performance | 2 | 8 | Implement IT Operations Analytics (ITOA) tool; train staff on proactive incident management approach |
Note: The “Action to be Taken” column provides a brief description of the recommended actions that should be taken to improve each capability area. These actions are based on the information provided in the Capability Improvement Plan for IT Operations table.
In summary, reviewing and adding actions to be taken based on the capability assessment is critical to improving the performance of the organization and achieving its goals and objectives. It provides a roadmap for improvement and helps to ensure that the necessary actions are taken to address the identified gaps.