


Mapping out a massive organizational structure used to be a total headache, but the AI Organization Chart Generator in Visual Paradigm has completely changed the game 🚀. If you have ever stared at a blank screen trying to figure out how to connect the Dean to the Department Head without making the diagram look like a bowl of spaghetti, you know the struggle is real. Visual Paradigm’s new AI-powered visual modeling software allows you to just type a simple description and watch the magic happen. It turns your plain text into a professional, easy-to-use organization chart in just a few seconds, making it the best online tool for HR pros and team leads alike.
In the world of professional diagramming, speed and accuracy are everything. The provided visuals show exactly how this works in a real-world scenario, specifically for a university administration. Instead of dragging boxes and lines manually, you just tell the AI what the hierarchy looks like. It’s like having a smart assistant who knows exactly how to organize departments, roles, and reporting relationships without breaking a sweat 💻. Whether you are using the desktop version or the AI-powered visual modeling chatbot, the process is totally smooth and stress-free.
Key Takeaways for AI Chart Generation
- Instant Visualization: Turn complex text descriptions into structured hierarchies immediately.
- Smart Detection: The AI automatically figures out who reports to whom based on your sentences.
- Multi-Platform Access: Generate charts using either the Visual Paradigm Desktop app or the web-based AI Chatbot.
- Full Customization: Every box and line generated is 100% editable so you can tweak the style later.
- Zero Design Skills Needed: You don’t need to be a pro artist to create professional-grade org charts.
How the AI Organization Chart Generator Works on Desktop
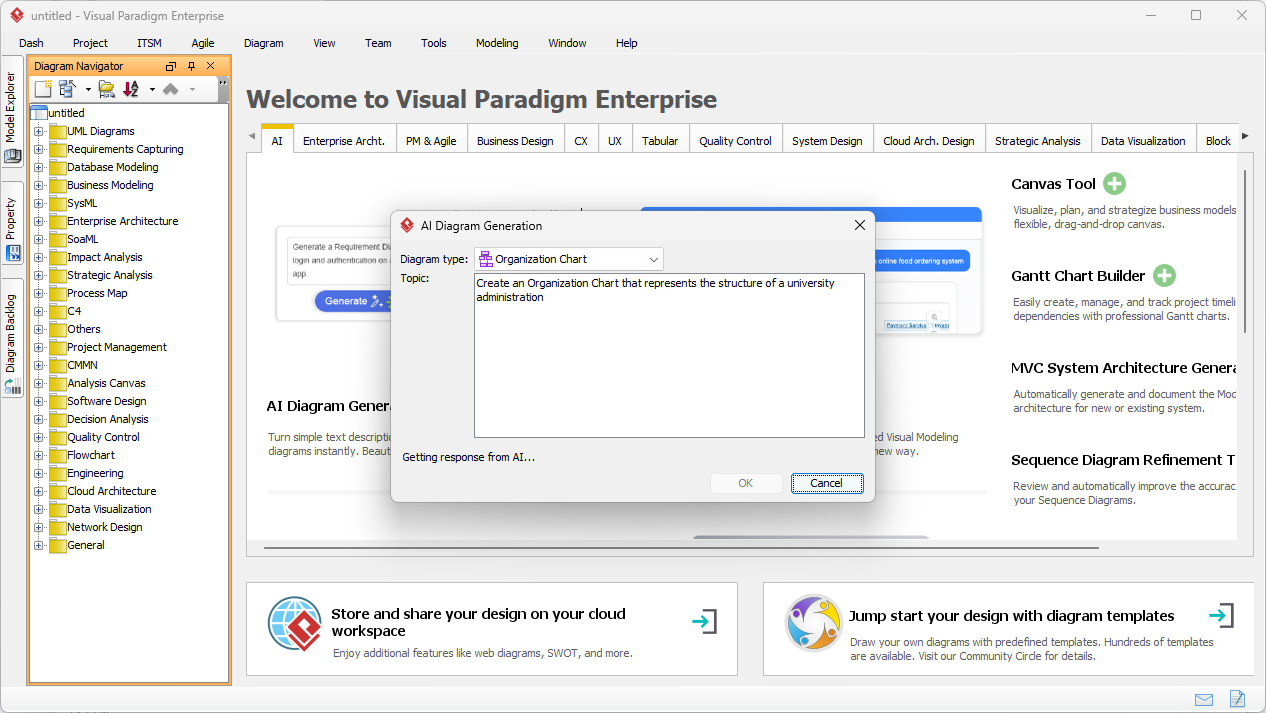
The first step to getting your organizational structure visualized is launching the AI Diagram Generation tool within the Visual Paradigm Desktop application. As seen in the first image, the interface is super clean and straightforward. You just select “Organization Chart” from the dropdown menu and type in your topic. In this specific case, the user typed: “Create an Organization Chart that represents the structure of a university administration.” This is the “Topic” or “Prompt” that gives the AI the instructions it needs to start building.
What’s really cool is how the AI-powered desktop handles the heavy lifting. You don’t have to specify every single connector. The AI Organization Chart Generator is smart enough to know that a “University Administration” usually includes things like Student Services and an Administrative Division. It uses natural language processing to “read” your intent and prepare a logical layout. This easy-to-use AI tool is a total lifesaver for people who need to create professional diagrams fast without getting bogged down in the technical details.
Analyzing the Generated University Hierarchy
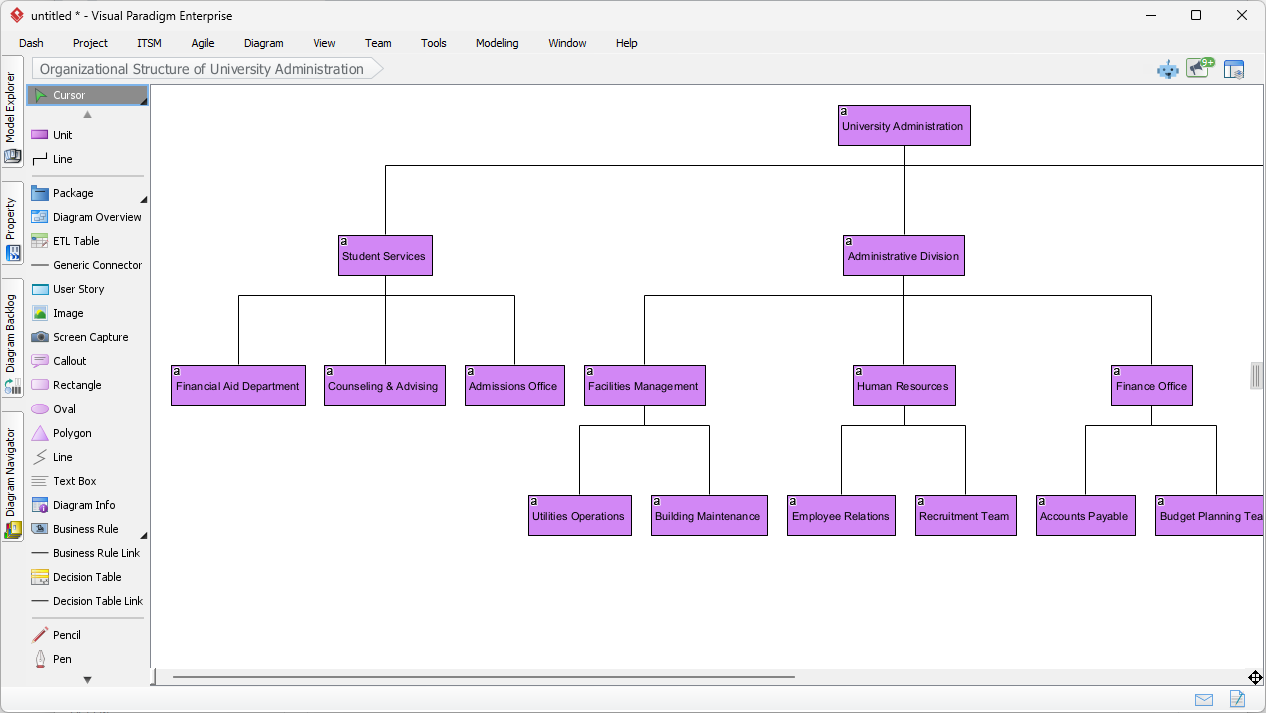
Once you click “OK,” the software generates a detailed, easy-to-read organization chart like the one shown in the second image. Notice how the “University Administration” sits at the very top as the Central Node. From there, it splits into two main branches: “Student Services” and “Administrative Division.” This vertical ranking is what we call Hierarchy Levels. The AI has correctly identified that departments like the “Financial Aid Department” and “Counseling & Advising” report directly to Student Services. These connections are represented by solid Reporting Lines, which show a clear supervisor-subordinate relationship.
The visual precision here is top-notch. Each box (or Position) is perfectly aligned, and the spacing is balanced so the chart doesn’t look cluttered. Even complex sub-departments, like “Utilities Operations” reporting to “Facilities Management,” are handled with ease. This best-in-class AI visual modeling ensures that the span of control—which is just a fancy way of saying how many people report to one manager—is visually clear. If you need to change anything, like adding a photo or changing a department color, you can do it right there in the editor. It’s totally flexible! 🎨
Using the AI Chatbot for Quick Corporate Models
Sometimes you aren’t at your main computer and need a quick chart on the go. That is where the Visual Paradigm AI Chatbot comes in. It is basically the world’s leading AI-powered visual modeling chatbot. As you can see in the third image, you can just send a chat message like, “Generate an Organization Chart to visualize the hierarchical structure of a corporate company,” and the chatbot replies with a full diagram for “TechNova Solutions.” This online AI tool is perfect for brainstorming sessions or quick meetings where you need a visual aid ASAP.
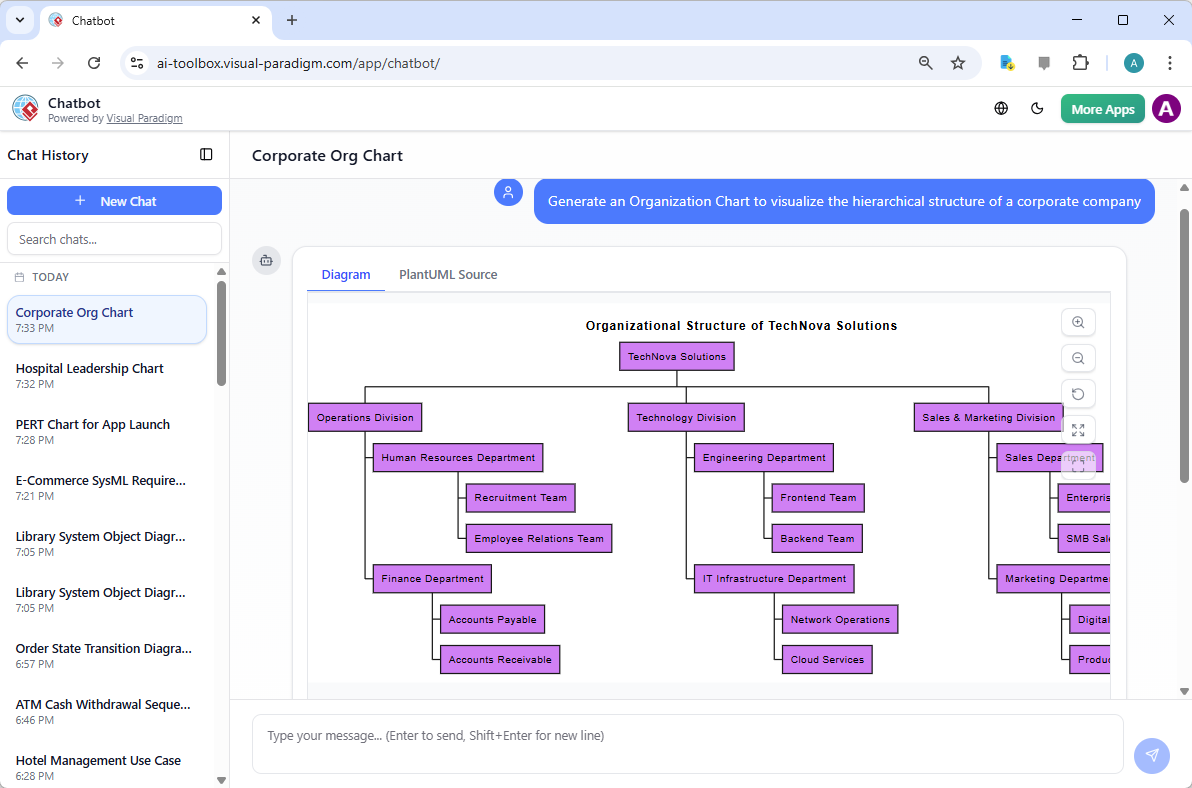
The chatbot version is just as smart as the desktop one. It breaks down the company into an “Operations Division,” “Technology Division,” and “Sales & Marketing Division.” It even goes deep into the weeds by including a “Recruitment Team” under Human Resources and “Cloud Services” under IT Infrastructure. This AI Organization Chart Generator doesn’t just give you a generic template; it builds a custom organizational structure based on the context of your request. It’s a professional and easy way to overcome “blank canvas syndrome” and get your ideas moving. 🚀
Key Benefits of AI-Driven Organizational Mapping
Using an AI Organization Chart Generator isn’t just about being “high-tech”—it’s about working smarter. For HR professionals, it means saving hours of manual labor. Instead of fighting with alignment tools, you spend your time actually planning the team structure. For business leaders, it allows for “What-If” scenarios. You can quickly generate a “flatter” version of your company structure to see how it looks before making any real-world changes. It makes organizational design accessible to everyone, regardless of their design experience.
Core Workflows to Master
- Initial Generation: Use a simple prompt to get the basic structure of your team or company down.
- Refinement: Use the editor to add specific employee names, job titles, or even photos to make it “official.”
- Matrix Reporting: Manually add Dotted-Line Reporting for project-based relationships that aren’t strictly top-down.
- Exporting: Once you’re happy, export your work as a high-res image or PDF for your next big presentation or the company handbook.
In conclusion, whether you are mapping out a complex university system or a agile tech startup, the AI Organization Chart Generator in Visual Paradigm is the ultimate professional tool. It blends the power of generative AI with the precision of traditional modeling. You get professional, easy-to-use, and visually stunning results every single time. Stop wasting time drawing boxes and start using AI to build your organizational structure today! 🌟
Ready to build your own AI-powered diagrams?
Transform your ideas into professional visuals in seconds. Whether you need a complex hierarchy or a simple team layout, our AI Organization Chart Generator is ready to help you succeed.
Try Visual Paradigm today: Download Visual Paradigm Desktop and experience the future of AI-powered visual modeling for yourself!
Related Links
- Creating an Organizational Chart for a School Department Using Visual Paradigm Smart Board: A comprehensive guide to designing clear and professional organizational charts for school departments using Visual Paradigm’s Smart Board.
- Online Organization Chart Maker – Create Professional Org Charts Easily: A powerful, web-based tool for creating professional organization charts with drag-and-drop functionality and customizable templates.
- Free Online Organization Chart Maker – No Download Required: A free, browser-based solution to design and share organization charts without installation or sign-up.
- How to Create an Org Chart Using Visual Paradigm Smart Board: A detailed tutorial showing how to build organization charts using the Smart Board feature in Visual Paradigm for collaborative design.
- Free Organizational Chart Tool – Create Charts in Minutes: A free, no-registration online tool to design and export professional organization charts with smart templates and real-time collaboration.
- Free Organization Chart Templates – Ready-to-Use Diagrams: A collection of professionally designed, customizable organization chart templates for immediate use in Visual Paradigm’s online platform.
- Customizing a RACI Chart in Visual Paradigm (PDF Guide): A downloadable PDF tutorial that walks users through customizing RACI charts in Visual Paradigm to suit specific project and organizational needs.