


Creating a PERT chart can be an overwhelming task. Mapping dozens of dependencies, estimating optimistic and pessimistic timeframes, and identifying the critical path manually takes hours of meticulous work. If you are looking to automate project scheduling, you need a professional AI PERT chart generator that understands task relationships and can visualize complex project networks instantly.
Visual Paradigm is the leader in AI-powered PERT diagram tools. Since 2002, we have provided the robust modeling features required for enterprise project management. Our integrated AI ecosystem allows you to calculate project duration with AI across desktop, web, and collaborative documents, ensuring your schedules are accurate, traceable, and ready for execution.
VP Desktop: Professional Powerhouse for AI-Driven PERT Modeling
VP Desktop is the flagship application for project managers who require automated dependency mapping with professional depth. It combines generative AI with a full modeling suite for precise critical path analysis.
How to Generate a PERT Chart with AI in VP Desktop
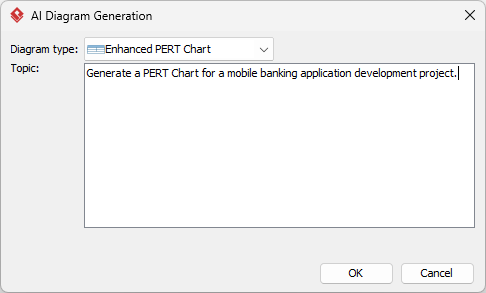
- Access the Generator: Select Tools > AI Diagram Generation from the main menu.
- Select Your Type: Choose Enhanced PERT Chart from the dropdown list.
- Describe Your Project: Input a prompt like: “Build a PERT chart for a mobile banking app launch, including user registration, transaction processing, security audits, and deployment.”
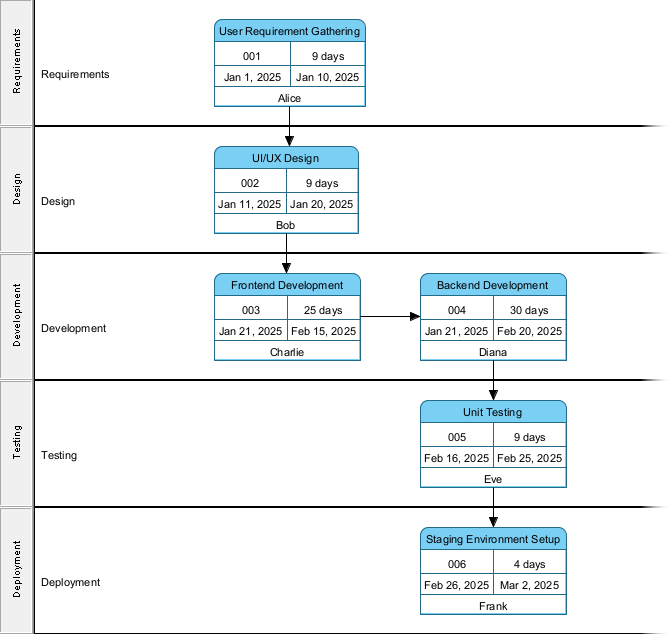
- Automated Generation: The AI renders a native, fully editable PERT chart with tasks, durations, and dependencies.
Unlike basic PERT chart creators, VP Desktop provides traceability to requirements and integration with Tasifier for task management. This ensures your project schedule is never a static image but a live part of your development lifecycle.
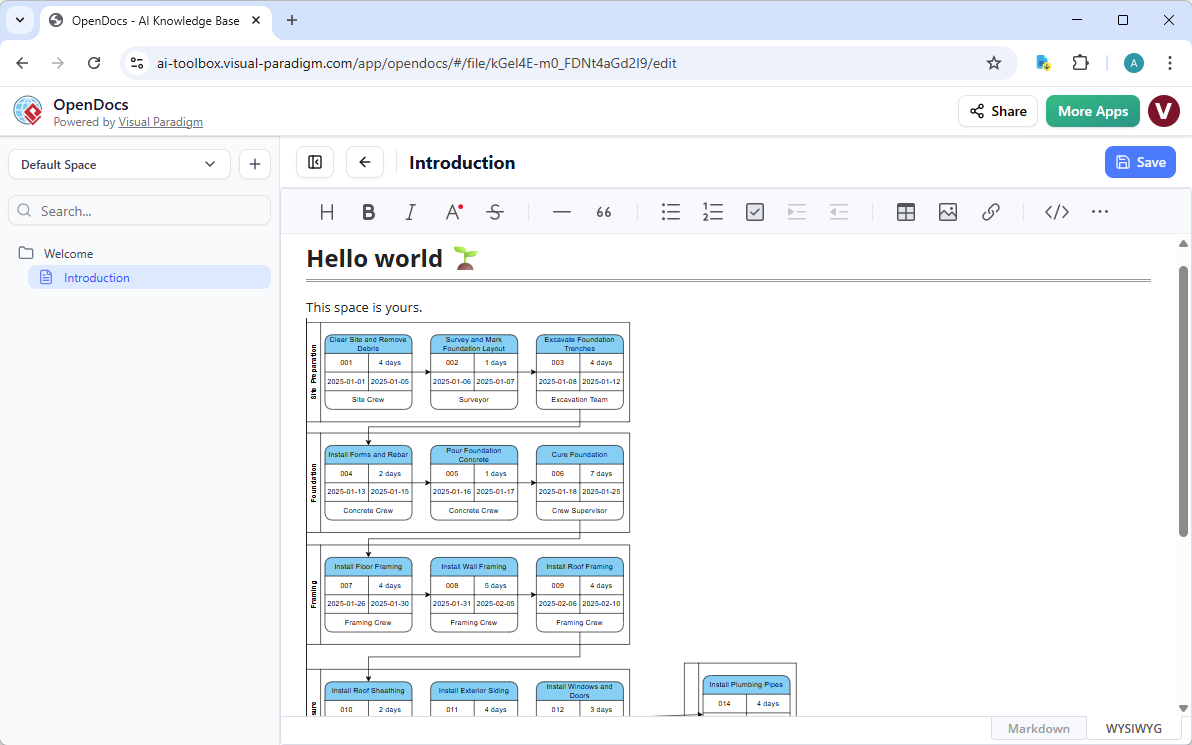
OpenDocs: Embed and Collaborate on Living AI PERT Charts
Project schedules change as reality shifts. OpenDocs allows you to integrate a project timeline visualization tool directly into your strategy documents and status reports.
Collaborate on PERT Diagrams in OpenDocs
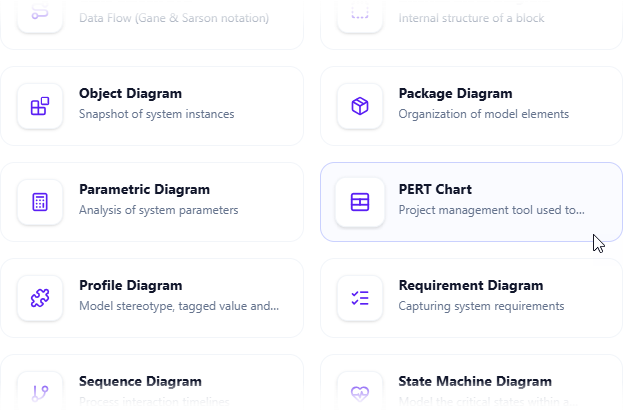
- Insert Diagram: In your document page, click Insert > Diagram > PERT Diagram.
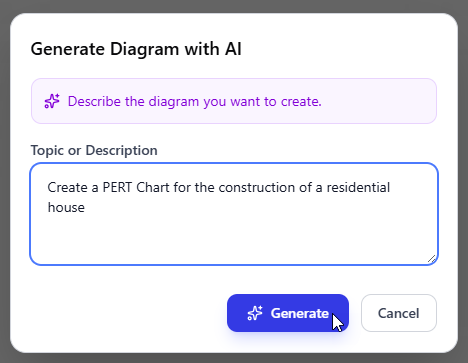
- Generate with AI: Describe your project phases and click Generate.
- Live Integration: The diagram embeds as an editable block. Team members can update time estimates inline, ensuring the critical path stays accurate throughout the project.
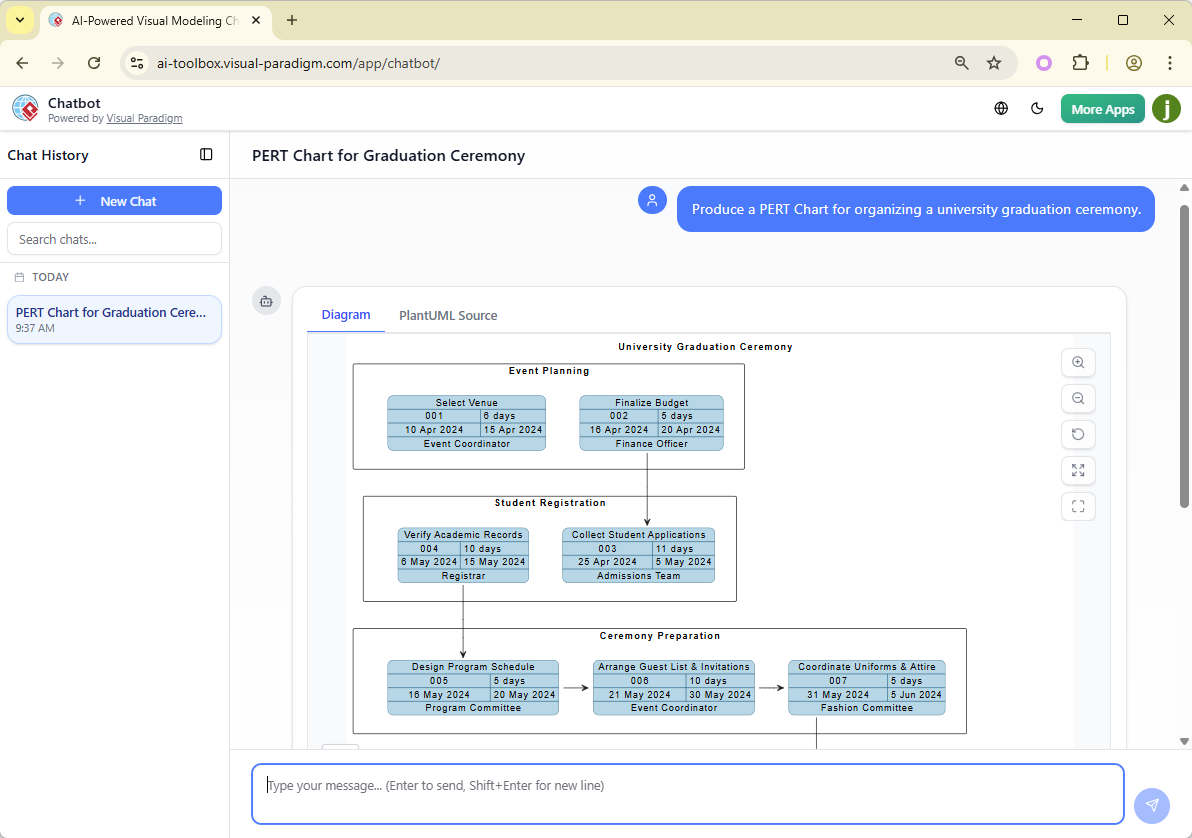
AI Visual Modeling Chatbot: Conversational Project Brainstorming
For rapid iteration, our AI Visual Modeling Chatbot lets you brainstorm project dependencies through simple dialogue. It’s the perfect critical path analysis AI for agile teams.
Simply ask: “Generate a PERT chart for launching an e-commerce site, then explain the critical path.” The AI builds the model and provides an instant analysis of which tasks will delay the project if they slip.
Why Visual Paradigm is the Best AI Tool for PERT Diagrams
While generic tools produce static boxes, Visual Paradigm provides a professional PERT software ecosystem built for project success:
- Enhanced PERT Features: Support for RACI, responsible assignments, and task milestones.
- Instant Critical Path: Visualize the most important sequence of tasks automatically.
- Multi-Platform Entry: Move fluidly between Chat, Desktop, and OpenDocs without data loss.
- Technical Traceability: Link PERT tasks to UML or BPMN models for a complete system view.
Modernize Your Project Planning Today
Stop wrestling with manual dependency lines and outdated estimates. Visual Paradigm’s AI PERT chart generator combines the ease of natural language with the precision of industry-standard scheduling. Experience how AI-powered visual modeling can make your projects faster, smarter, and more reliable.