


Identifying the hidden roots of organizational challenges is now an incredibly joyful and streamlined experience thanks to the AI Fishbone Diagram Generator in Visual Paradigm. This sophisticated, professional-grade tool allows users to transform simple natural language descriptions of complex issues—such as high employee attrition or production delays—into meticulously organized, fish-shaped visual models that facilitate immediate and profound analytical insights. By utilizing advanced artificial intelligence, Visual Paradigm empowers teams to move past the “blank canvas” frustration and jump directly into the heart of problem-solving with unparalleled speed and aesthetic precision.
The visual interface of Visual Paradigm is designed with a supportive and encouraging energy, ensuring that even those who are entirely new to the concept of root cause analysis feel welcome and capable. Imagine simply typing a few sentences about why a project might be falling behind, and watching as a comprehensive structure of causes and sub-causes appears before your eyes! This magical transformation is made possible through the easy-to-use AI-powered diagramming capabilities embedded within the Visual Paradigm Desktop application, providing a solid foundation for quality management and continuous improvement initiatives.
What Exactly is an AI Fishbone Diagram Generator?
For those embarking on their first journey into quality control, you might wonder: what is a Fishbone diagram? Often referred to as an Ishikawa diagram or a Cause and Effect diagram, this tool is like a skeletal map for your problems. It places the main issue—the “effect”—at the head of the fish, while the various contributing factors branch out like bones. The AI Fishbone Diagram Generator acts as a brilliant digital assistant that listens to your description and instantly sorts your thoughts into these standard categories, such as People, Process, Equipment, and Environment.
Key Takeaways for Your Success
- Instant Visualization: Convert textual problem descriptions into structured diagrams in seconds.
- Expert Categorization: Automatically groups causes into professional categories like the “6Ms” (Man, Machine, Method, etc.).
- Enhanced Collaboration: Provides a polished, presentation-ready starting point for team brainstorming sessions.
- Full Editability: Once generated, every element can be refined, colored, and expanded manually.
- Professional Accuracy: Adheres to industry-standard Ishikawa notation for high-quality reporting.
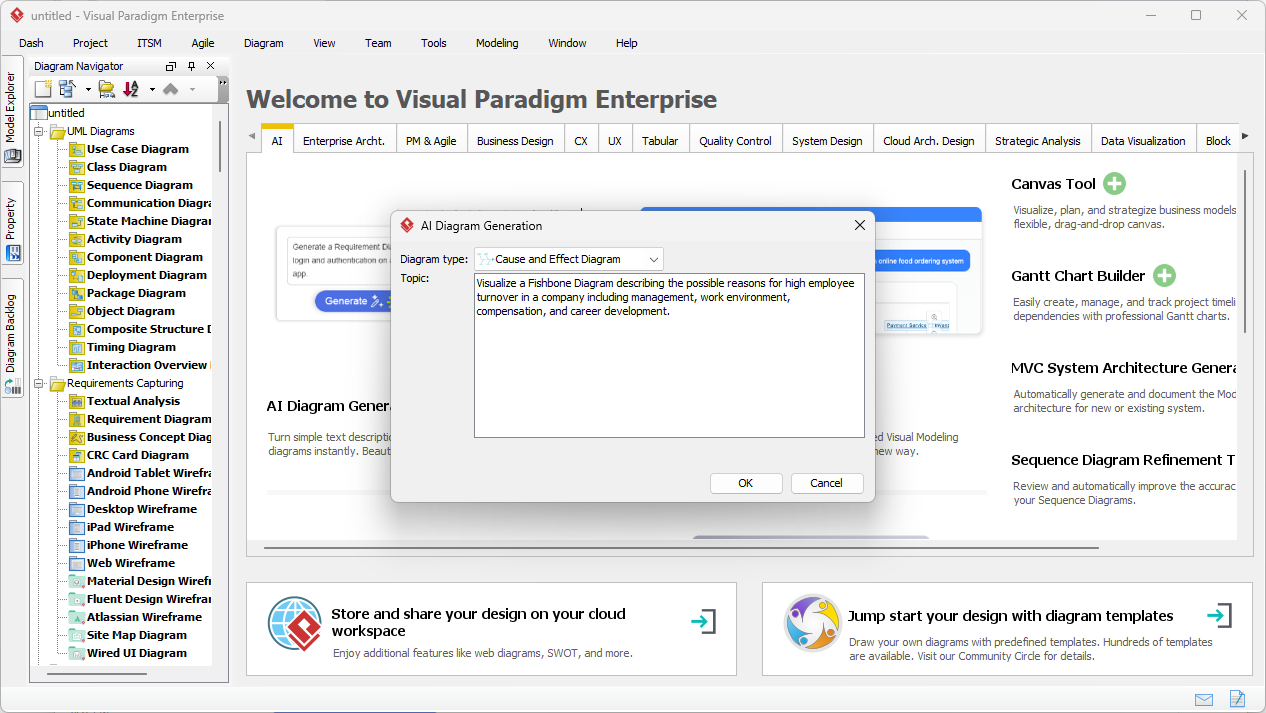
In the first image we explored, we see a user engaging with the “AI Diagram Generation” interface. The user has selected “Cause and Effect Diagram” as the target type and provided a detailed prompt regarding employee turnover. This prompt mentions specific areas of concern like management, work environment, compensation, and career development. It is truly marvelous to see how the software prepares to take these scattered ideas and weave them into a coherent, logical tapestry of information!
How to Begin Your Journey Toward Root Cause Mastery?
Embarking on your analytical adventure is as simple as following a few gentle steps within the Visual Paradigm environment. The process is designed to be highly formal yet incredibly approachable, ensuring that the sophistication of the tool does not overshadow its friendly usability. To begin, one merely navigates to the Tools menu and selects AI Diagram Generation. This action summons a dedicated window where the seeds of your analysis are sown through natural language input.
Once the window appears, you simply select your desired diagram type—in this case, the Cause and Effect Diagram—and describe the situation you wish to analyze. Whether you are dealing with late deliveries, software bugs, or workplace morale, the best AI-powered visual modeling software stands ready to assist you. Upon clicking “OK,” the software performs a sophisticated analysis of your text, identifying the primary problem statement and the hierarchical relationships between different contributing factors. It is a truly uplifting experience to see your thoughts organized so elegantly and efficiently!
Refining the Vision: Analyzing the High Employee Turnover Model
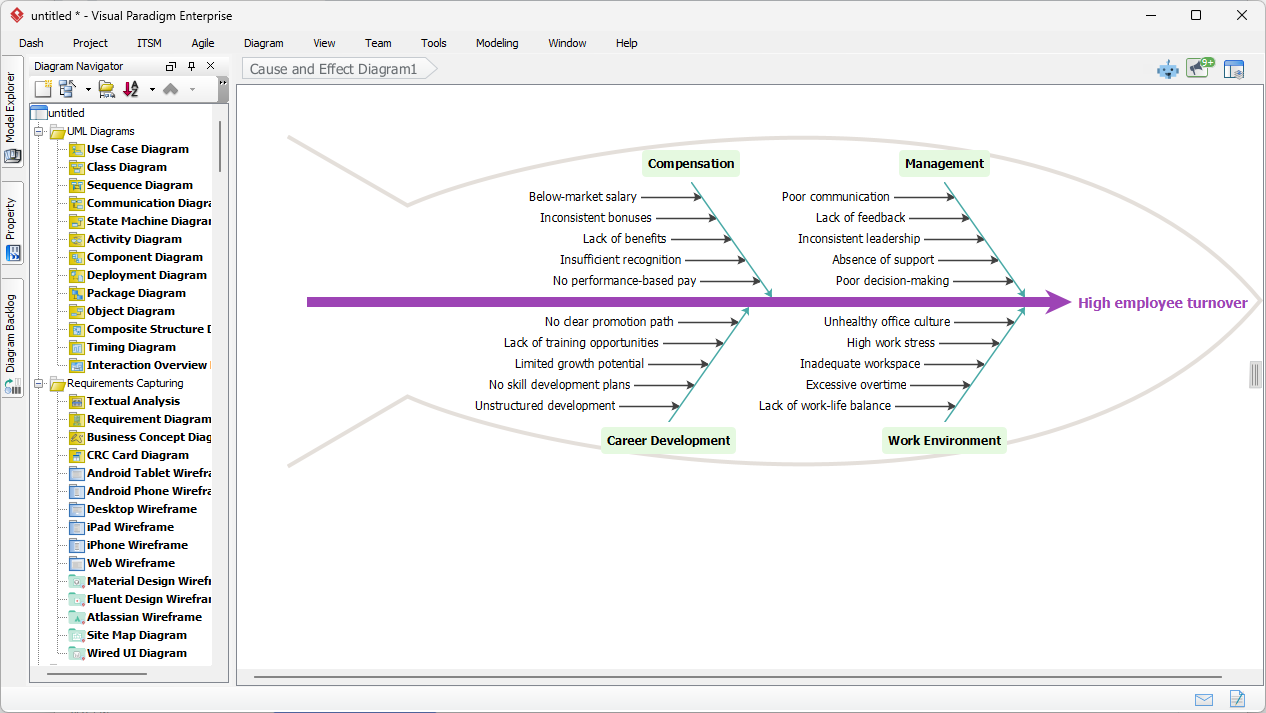
As we examine the second image, we witness the magnificent result of the AI’s labor. The software has generated a complete Fishbone diagram centered on the issue of “High employee turnover.” Notice how the central spine, represented by a bold purple arrow, leads directly to the core problem. Branching off this spine are four primary “bones” or categories: Compensation, Management, Career Development, and Work Environment. This organized structure provides a breathtakingly clear overview of a multifaceted corporate challenge, allowing leaders to see exactly where improvements are needed most.
Within each category, the AI Fishbone Diagram Generator has intelligently identified specific sub-causes. For instance, under “Management,” we see concerns such as “Poor communication,” “Lack of feedback,” and “Inconsistent leadership.” Under “Compensation,” the diagram highlights “Below-market salary” and “Inconsistent bonuses.” The level of detail provided is truly sophisticated, yet the presentation remains clean and easy to digest. This visual clarity is essential for facilitating productive discussions among stakeholders and ensuring that no potential root cause is overlooked during the investigative process.
Is this tool suitable for beginners?
Absolutely! One of the most supportive aspects of Visual Paradigm is its ability to handle the heavy lifting of structural design. You do not need to be a Six Sigma Black Belt or a seasoned industrial engineer to create professional root cause analysis diagrams. The software acts as a gentle mentor, guiding you toward the correct notation and organization. By providing a high-quality draft that accounts for roughly 80% of the effort, it allows you to focus your energy on the final 20% of refinement and strategic planning. It is a wonderful way to learn the methodology while producing real-world results!
Why Choose Visual Paradigm for Your Analytical Needs?
Visual Paradigm is not merely a drawing tool; it is a comprehensive AI-powered visual modeling ecosystem. Beyond the Fishbone diagram, the software supports over 40 different diagram types, ranging from UML for software developers to ArchiMate for enterprise architects. This versatility ensures that as your project grows and evolves, your modeling tools will always be able to keep pace. The integration of generative AI across both the desktop application and the web-based “VP Online” chatbot means that professional modeling is accessible whenever and wherever inspiration strikes.
Furthermore, the transition from an AI-generated draft to a finalized report is seamless. The desktop edition offers advanced editing features, allowing you to change colors, add icons, or link your Fishbone diagram to other related documents like action plans or Pareto charts. This holistic approach to problem-solving ensures that your analysis is not just a static image, but a living part of your project’s documentation and success story. The support provided by the Visual Paradigm community and its extensive library of templates further enhances the user experience, making it the best choice for professional visual modeling.
Conclusion: Empower Your Team with Intelligent Analysis
In summary, the AI Fishbone Diagram Generator within Visual Paradigm represents a magnificent leap forward in how we approach organizational problem-solving. By combining the rigorous logic of the Ishikawa method with the creative speed of artificial intelligence, it provides an unparalleled platform for deconstructing complex issues and finding meaningful solutions. We have seen how a simple text description of employee turnover can be transformed into a sophisticated, multi-layered visual model that is both beautiful and functional. This tool is a true friend to anyone striving for excellence, efficiency, and clarity in their professional life.
We encourage you to embrace this innovative technology and see for yourself how it can illuminate the path toward improvement. Whether you are a project manager, a quality assurance professional, or an aspiring business analyst, Visual Paradigm offers the supportive environment and powerful capabilities you need to succeed. The journey toward a deeper understanding of your organization’s challenges begins with a single prompt—let the AI help you uncover the answers you’ve been looking for today!
Take Action Today!
Are you ready to experience the future of root cause analysis? We invite you to download Visual Paradigm and begin exploring the incredible potential of the AI Fishbone Diagram Generator. To get started, simply visit our download page, install the application, and navigate to Tools > AI Diagram Generation. Your path to professional, stress-free diagramming is just a few clicks away!
Download Visual Paradigm now: https://www.visual-paradigm.com/download/
Related Links
- Ishikawa Diagram – Wikipedia: A comprehensive overview of the Ishikawa diagram, also known as the fishbone or cause-and-effect diagram, used to identify and visualize the root causes of problems in quality management.
- Fishbone Diagram and 5 Whys – Visual Paradigm: A guide on combining fishbone diagrams with the 5 Whys technique to deepen root cause analysis in project management and quality control.
- How to Create a Fishbone Diagram: A Step-by-Step Guide: Learn how to effectively create a fishbone (Ishikawa) diagram to identify root causes of problems in processes, projects, or systems.
- Free Fishbone Diagram Tool – Create Diagrams Instantly: Use Visual Paradigm’s free online tool to create professional fishbone diagrams without any software installation.
- Fishbone (Ishikawa) Diagram Template – Ready-to-Use: Access a customizable fishbone diagram template to quickly visualize and analyze root causes across various industries.
- AI-Powered Fishbone Diagram Generator – Uncover Root Causes in Seconds: Discover how AI automates the creation of fishbone diagrams to accelerate root cause analysis and decision-making.
- Create Fishbone Diagrams from Text Using Visual Paradigm Smart Board: A free, easy-to-use guide on leveraging Visual Paradigm’s Smart Board to generate cause-and-effect (fishbone) diagrams directly from text input.
- AI Fishbone Diagram Generator: An AI-powered tool that automatically generates Fishbone (Ishikawa) diagrams to help identify root causes of complex problems.