


Every project manager knows the frustration of a stalled process, but identifying exactly where the gears are grinding to a halt can feel like finding a needle in a haystack. Thankfully, Visual Paradigm has introduced a revolutionary way to visualize your operations. By utilizing an AI-powered Value Stream Mapping editor, professionals can now transform complex, uncoordinated business activities into clear, data-driven visual maps. This innovative tool doesn’t just draw shapes; it acts as a strategic partner, helping you identify waste and optimize process cycle times with the precision of a seasoned consultant. In this guide, we will explore how you can go from a vague problem description to a sophisticated, professional diagram in just a few clicks.
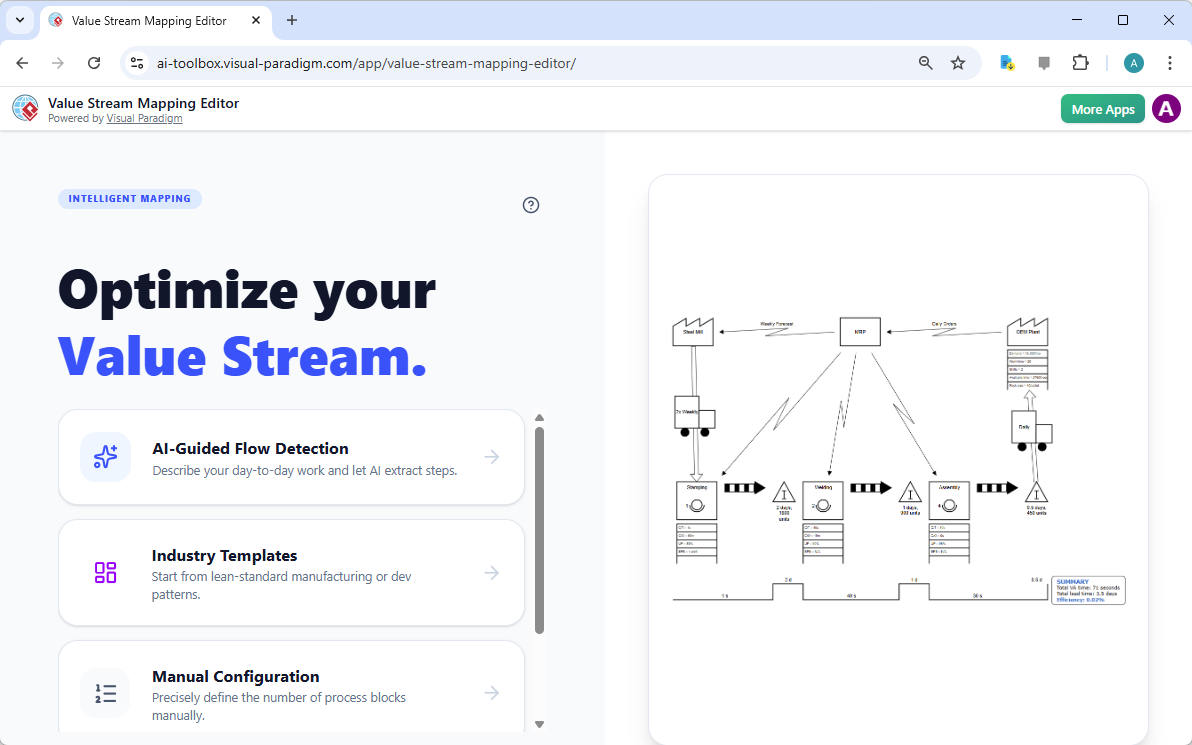
When you first launch the application, you are greeted by an interface designed for maximum clarity and efficiency. The startup screen offers three distinct paths to success: using an AI prompt to detect flows automatically, starting with a tried-and-true industry template, or taking the reins with manual configuration. This flexibility ensures that whether you are a Lean practitioner or a business analyst, you have the perfect starting point for your process improvement journey. It feels incredibly empowering to see such a clean, intuitive dashboard ready to tackle your toughest operational challenges!
Step 1: Harnessing AI-Guided Flow Detection
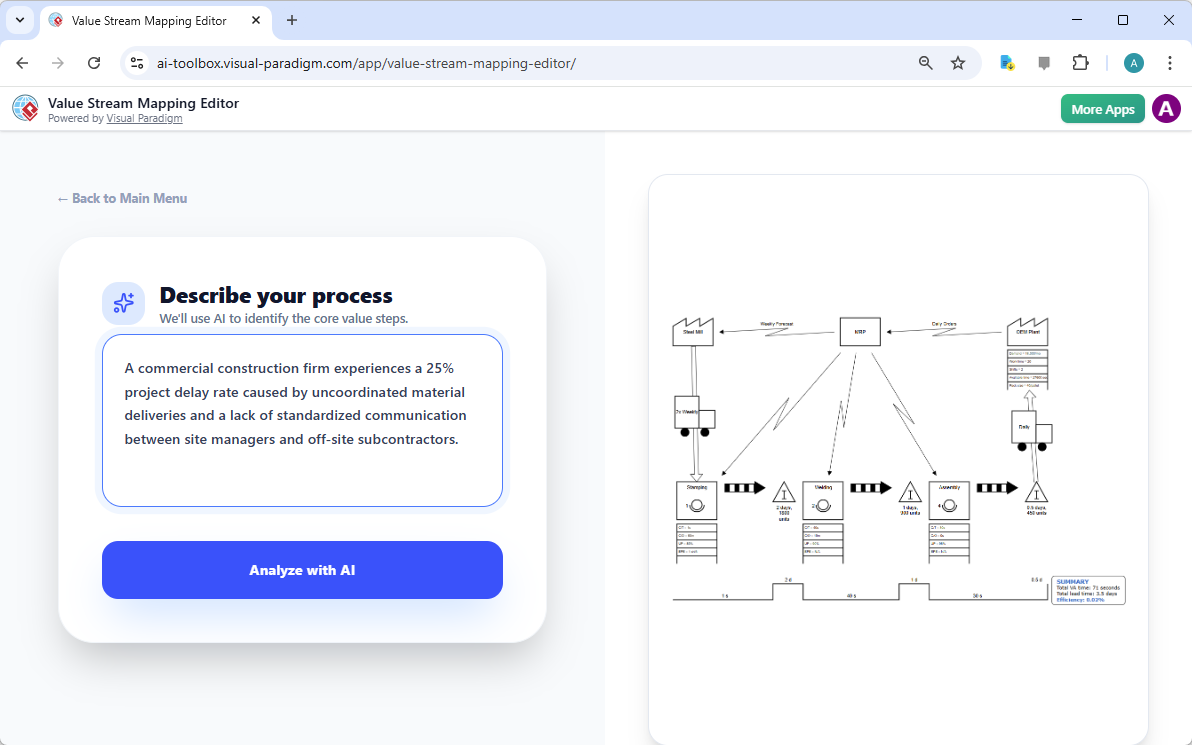
The most exciting way to begin is through the “AI-Guided Flow Detection” feature. Imagine you are dealing with a specific bottleneck—for instance, a commercial construction firm experiencing a 25% project delay due to uncoordinated material deliveries. Instead of manually mapping every single interaction from scratch, you simply describe your process in plain English. You provide the context, such as the lack of communication between site managers and subcontractors, and let the AI do the heavy lifting of extracting core value steps. It’s like having a brilliant assistant who listens to your story and immediately starts organizing the chaos into a logical sequence.
Once you have entered your problem description, clicking the “Analyze with AI” button initiates a sophisticated scanning process. The tool identifies the suppliers, customers, and internal process steps hidden within your narrative. This intelligent mapping approach removes the “blank canvas” anxiety that often accompanies complex diagramming tasks. It’s a truly motivational experience to see your real-world problems being translated into a structured format so quickly and accurately!
Step 2: Visualizing the Big Picture
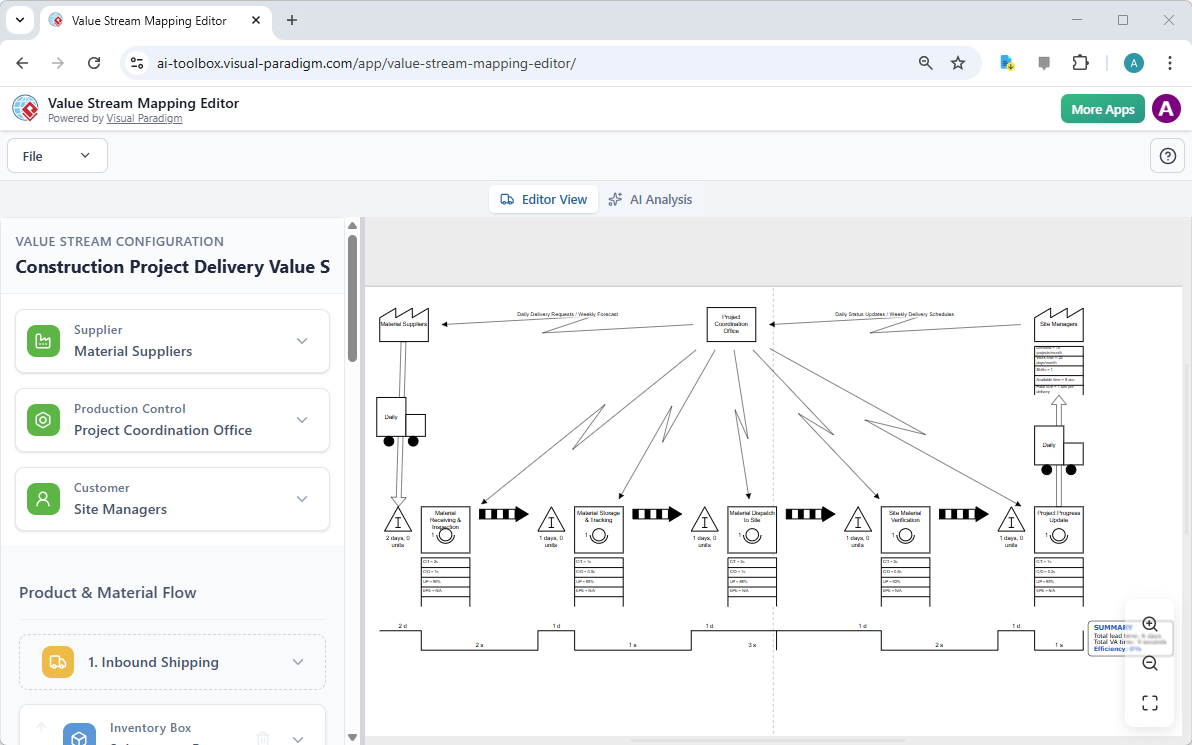
Within moments, the AI-powered Value Stream Mapping editor generates a comprehensive diagram. This isn’t a static image; it is a living, breathing model of your workflow. You will see your material suppliers, project coordination offices, and site managers all connected by intricate information and material flows. The diagram automatically includes standard VSM symbols, such as inventory triangles and transport trucks, ensuring your map adheres to global Lean standards. The split-pane editor allows you to see the structured data on the left while the diagram updates in real-time on the right, providing instant visual feedback that feels like magic.
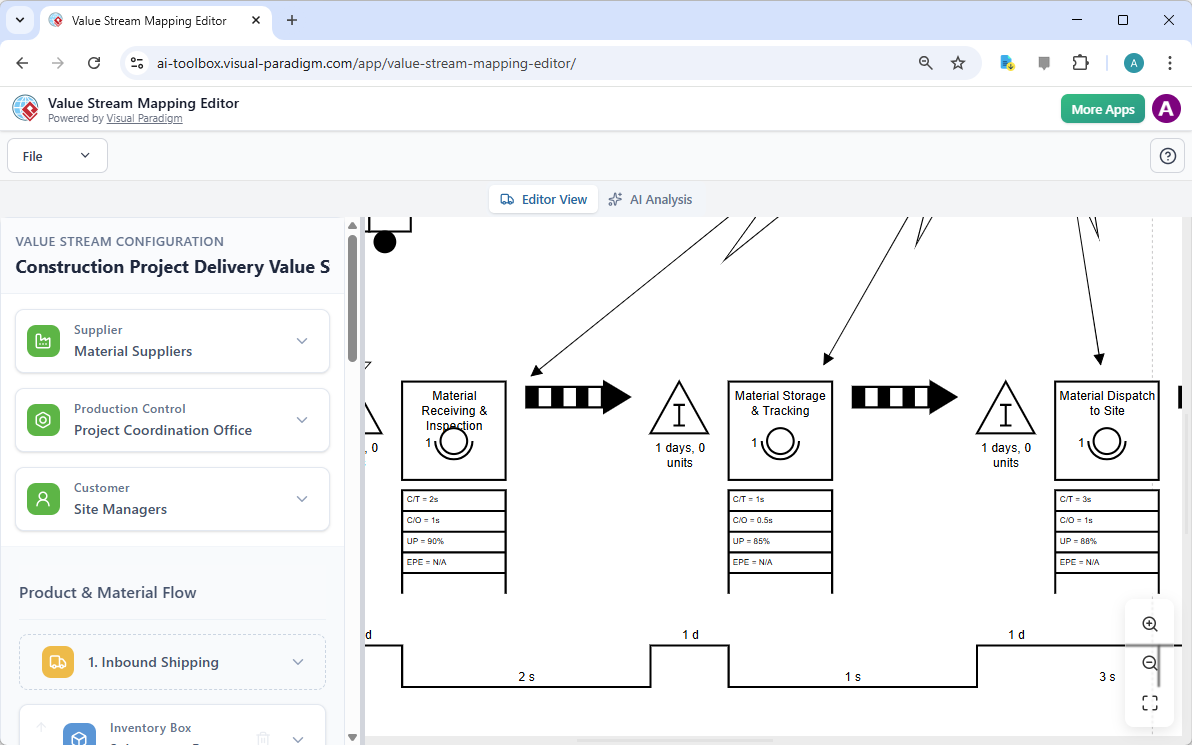
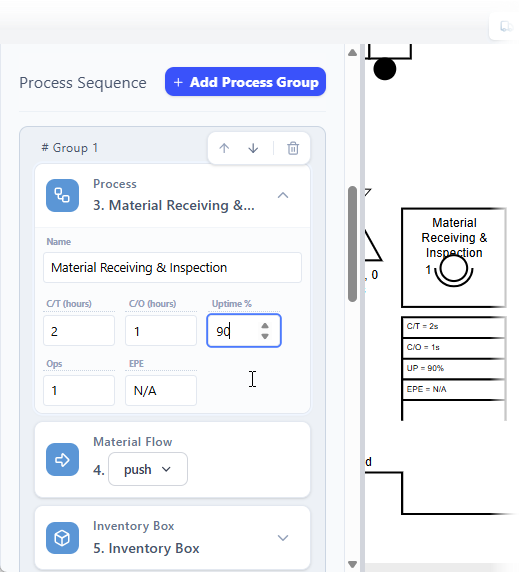
To ensure total accuracy, you can use the navigation tools to dive deeper into the details. The editor provides a zoomed view that allows you to inspect every individual process block and data box. You can clearly see metrics like Cycle Time (C/T), Changeover Time (C/O), and Uptime. This level of detail is essential for spotting hidden waste, such as long waiting times between “Material Storage & Tracking” and “Material Dispatch to Site.” By seeing the diagram clearly, teams can use it as a shared language to discuss improvements and foster buy-in from all stakeholders.
Step 3: Refining Your Map with Structured Data
While the AI provides a fantastic head start, the real power lies in your ability to refine the data. On the left-hand configuration pane, you can edit the specific properties of each process step. For example, if your “Material Receiving & Inspection” step actually has a 90% uptime instead of the default, you can simply type the new value into the field. As you adjust these numbers, the automatic diagram generation engine repositions elements and updates the timeline at the bottom of the map. This data-driven mapping ensures that your VSM is not just a pretty picture, but a precise mathematical representation of your current state.
Key Takeaways for Mapping Success
- Focus on Flow: Always map the movement of both materials and information to see the complete value stream.
- Data Over Intuition: Use actual metrics for Lead Time and Process Time to make informed, data-driven decisions.
- Identify the Seven Wastes: Look for overproduction, waiting, and defects that the AI highlights in your map.
- Iterate for the Future: Save your “Current State” and then modify data to simulate a “Future State” and project potential gains.
- Collaborate Early: Share the exported PNG images with your team to ensure everyone agrees on the process steps.
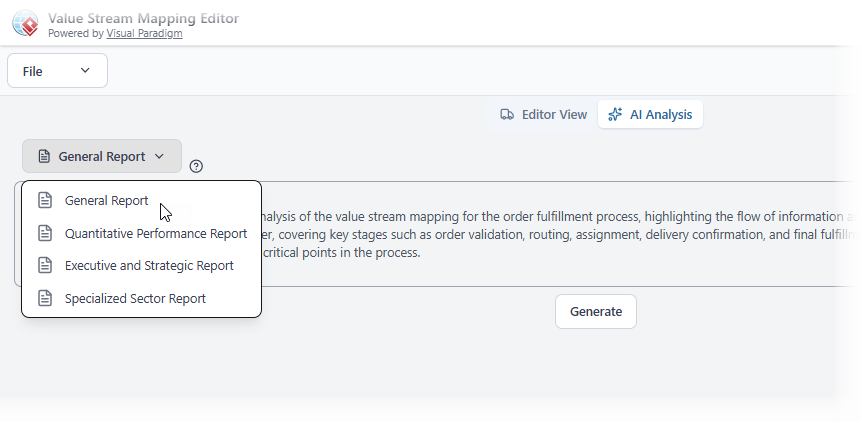
Step 4: Unlocking AI-Powered Insights and Reports
Mapping the process is only half the battle; the next step is analysis. The AI Analysis view is where the tool truly shines as a consultant. By switching to the analysis tab, you can request a variety of professional reports. Whether you need a Quantitative Performance Report to look at the hard numbers or an Executive and Strategic Report for high-level stakeholders, the editor has you covered. The AI reviews your VSM to pinpoint bottlenecks—those pesky steps with the longest cycle times—and offers actionable suggestions for optimization.
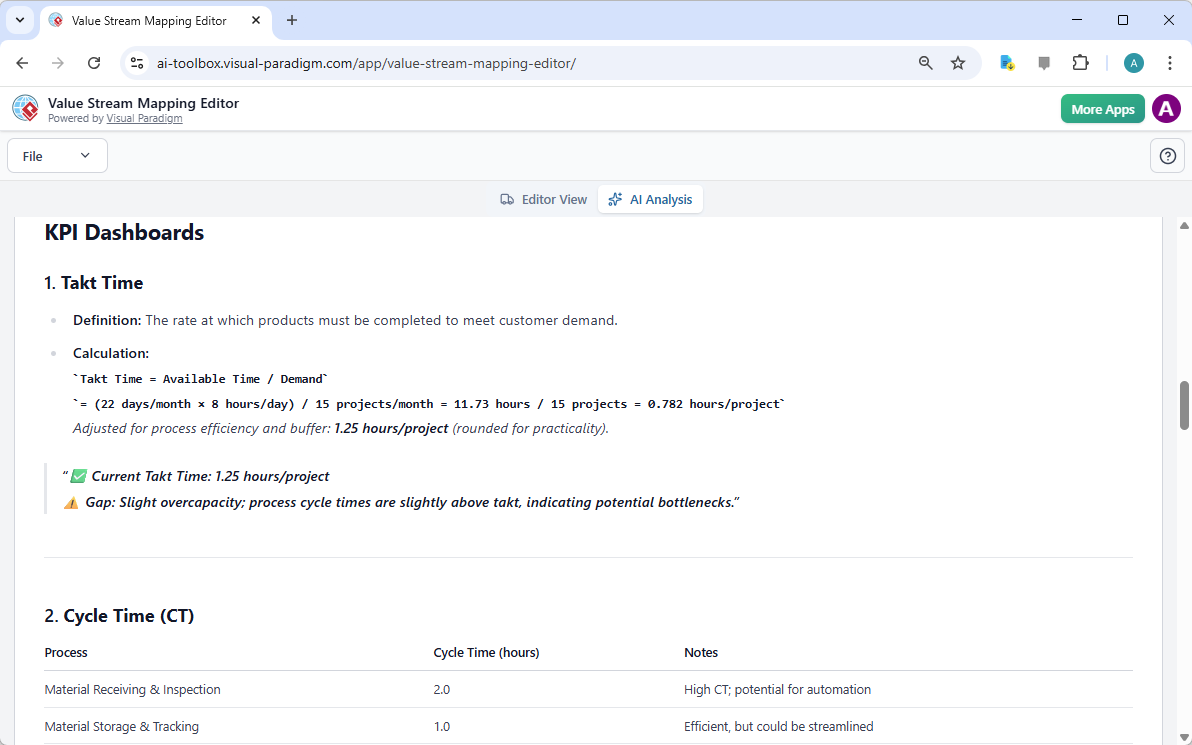
The resulting reports are stunningly detailed. You will receive a KPI Dashboard that calculates critical metrics like Takt Time (the rate at which you must complete work to meet demand). For instance, in our construction example, the AI might calculate a Takt Time of 1.25 hours per project and warn you that your current cycle times are slightly above this, indicating a potential bottleneck. This automated insight gives you a professional-grade analysis that would typically take hours of manual calculation, presented in an easy-to-read format with clear definitions and improvement notes.
Conclusion: Empower Your Process Excellence
The journey from a disorganized process to a high-efficiency machine starts with visibility. By using Visual Paradigm’s AI-powered Value Stream Mapping editor, you gain a holistic view of your operations that makes waste impossible to ignore. This tool bridges the gap between raw data and actionable insights, allowing process improvement managers and operations leads to accelerate their improvement cycles with confidence. It’s a calm, objective way to look at your business, backed by the power of modern artificial intelligence and a professional VSM tool.
Are you ready to transform your workflow and unlock new levels of productivity? Don’t let your process stay a mystery. Start mapping your success today and see how easy it is to build a leaner, more effective business! Visit the AI Value Stream Mapping Editor landing page to learn more about its features, or jump right into the action with the Try Now link below. Your future, optimized state is just a few clicks away!
Learn More: Visual Paradigm AI VSM Editor Info
Try Now: Launch the Value Stream Mapping Editor App
Related Links
Value stream mapping (VSM) is a strategic framework used to visualize workflows and identify inefficiencies within a process, ultimately helping teams to eliminate waste and improve value delivery. By mapping end-to-end processes, organizations can track lead times, identify bottlenecks, and align their capabilities with strategic goals.
- What Is Value Stream Mapping? A Complete Guide: A foundational guide explaining how VSM visualizes workflows to identify and eliminate waste, thereby improving process efficiency.
- Comprehensive Guide to Value Stream Mapping: This article covers the fundamentals, benefits, and step-by-step procedures for continuous business improvement through mapping.
- Value Stream Mapping Tool – Visual Paradigm: An overview of a tool designed to help organizations streamline processes and improve operational efficiency through visual analysis.
- Value Stream Mapping as an Artifact of the Vision Phase: Explores how VSM serves as a key artifact to align teams and define strategic direction during the early phases of product development.
- How to Use Value Stream Mapping in Six Sigma Projects: Details how VSM reveals process bottlenecks and reduces cycle times to enable data-driven improvements in Six Sigma contexts.
- Eliminate Waste with Value Stream Mapping: A Practical Approach: A practical guide for identifying and removing the eight types of waste in both manufacturing and service-based environments.
- Value Stream to Capability Cross-Mapping View in ArchiMate: A specialized template for enterprise architects to map value streams directly to organizational capabilities using the ArchiMate framework.
- Free Value Stream Mapping Templates: A library of ready-to-use templates designed to accelerate process mapping and help teams uncover improvement opportunities.
- Value Stream Mapping Software – Visual Paradigm Online: An introduction to cloud-based software for collaborative workflow design and optimization for lean manufacturing.
- Value Stream Mapping Template for Bottleneck Identification: A professional template used to visualize end-to-end processes and track critical metrics like lead times.