


What is a Data Flow Diagram (DFD)?
A Data Flow Diagram (DFD) is a graphical representation used to visualize the flow of data within a system. It shows how data is processed by identifying the sources, destinations, and how the data moves between processes, data stores, and external entities. Essentially, it maps out the inputs and outputs of a system’s processes.
Why Use a DFD?
-
Clarity and Understanding: DFDs help stakeholders understand how the system works by providing a clear and visual representation of data flows.
-
Identifying Inefficiencies: By mapping out data flows, organizations can identify bottlenecks, redundancies, and inefficiencies in their processes.
-
Improved Communication: DFDs serve as a common language for developers, analysts, and stakeholders, facilitating better communication and collaboration.
-
System Analysis and Design: DFDs are essential tools for analyzing and designing systems, ensuring that all aspects of data movement are considered.
-
Documentation: They provide valuable documentation for the system, which is useful for future reference and maintenance.
How to Create a DFD
-
Identify the Processes: Determine the key processes within the system. Each process will have a specific function, such as processing orders or generating reports.
-
Determine the External Entities: Identify external entities that interact with the system, such as customers, suppliers, or other systems.
-
Define Data Stores: Determine where data is stored within the system. This could be databases, files, or any other type of data repository.
-
Map Data Flows: Identify how data flows between processes, data stores, and external entities. Use arrows to represent the flow of data.
-
Create the Diagram: Use standard DFD symbols to create the diagram. Processes are typically represented by circles or rectangles, data flows by arrows, data stores by open-ended rectangles, and external entities by squares or ovals.
Example Symbols
-
Process: Represented by a circle or rounded rectangle.
-
Data Flow: Represented by arrows.
-
Data Store: Represented by an open-ended rectangle.
-
External Entity: Represented by a square or oval.
Steps to Draw a DFD
-
Start with a Context Diagram: Begin with the highest level (Level 0 DFD) showing the system and its interaction with external entities.
-
Decompose into Lower Levels: Break down the system into more detailed DFDs (Level 1, Level 2, etc.) to provide a deeper understanding of data flows.
-
Label Everything Clearly: Ensure all processes, data flows, data stores, and external entities are clearly labeled.
-
Validate with Stakeholders: Review the DFD with stakeholders to ensure accuracy and completeness.
DFD Case Study
Using a DFD can be a game-changer for understanding and optimizing your system’s data flow. Dive in and start mapping! ?
Background
In this tutorial, we’ll explore a Data Flow Diagram (DFD) and how it can be applied to a food ordering system. This case study focuses on enhancing the efficiency of a restaurant’s ordering process by visualizing data movement within the system.
CityBite, a popular urban restaurant, faced challenges in managing orders, inventory, and reporting. To streamline operations and improve service delivery, they decided to analyze and re-engineer their food ordering system using a Data Flow Diagram (DFD).
Objective
The goal was to gain a clear understanding of how data flows between different entities, processes, and data stores within the system. This visualization would aid in identifying bottlenecks and areas for improvement.
System Overview
CityBite’s food ordering system involves interactions between customers, the kitchen, suppliers, and the restaurant management. The DFD captures these interactions, providing a comprehensive view of data movement.
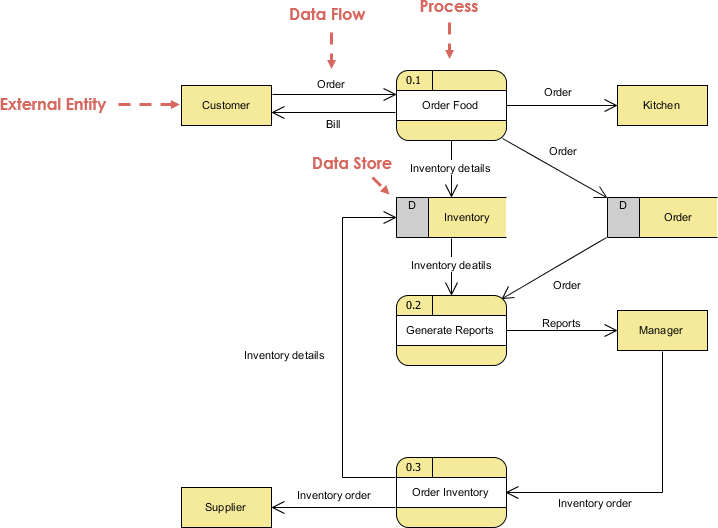
Components of the DFD
1. External Entities:
-
Customer: Places an order and receives a bill.
-
Supplier: Receives inventory orders from the restaurant system.
2. Processes:
-
Order Food (0.1): Handles the customer’s order and sends it to the kitchen. It also generates a bill for the customer.
-
Generate Reports (0.2): Generates reports based on inventory details and sends them to the manager.
-
Order Inventory (0.3): Places inventory orders to the supplier based on inventory details.
3. Data Stores:
-
Inventory: Holds inventory details used by various processes.
4. Data Flows:
-
Order: Sent from the customer to the “Order Food” process.
-
Bill: Sent from the “Order Food” process to the customer.
-
Order: Sent from the “Order Food” process to the kitchen.
-
Inventory details: Sent from the “Order Food” process to the “Inventory” data store.
-
Inventory details: Sent from the “Inventory” data store to the “Generate Reports” process.
-
Reports: Sent from the “Generate Reports” process to the manager.
-
Inventory details: Sent from the “Inventory” data store to the “Order Inventory” process.
-
Inventory order: Sent from the “Order Inventory” process to the supplier.
Brief Description of the Image
The image is a Data Flow Diagram (DFD) for the food ordering system at CityBite. It visually depicts how data flows between different entities, processes, and data stores:
-
Customers place orders, which are processed by the Order Food process. This process communicates with the kitchen and generates a bill for the customer.
-
Inventory details are updated and stored, facilitating inventory management.
-
The Generate Reports process uses these details to create reports for management, aiding in decision-making.
-
Inventory orders are placed with suppliers to replenish stock, ensuring a smooth operation.
Implementation Outcome
Using the DFD, CityBite was able to identify inefficiencies in their food ordering system. By visualizing data flows, they streamlined operations, reduced order processing time, and improved inventory management, resulting in better customer service and operational efficiency.
Conclusion
This case study highlights the importance of using Data Flow Diagrams to visualize and analyze the flow of data within a system. For CityBite, the DFD provided valuable insights that led to significant improvements in their food ordering process. Embrace this technique to enhance your system analysis and design efforts. ?