


Imagine a systems analyst tasked with documenting the intricate data movements of a modern e-commerce platform. The manual creation of these models often consumes hours of meticulous work, yet with a professional AI Data Flow Diagram Generator, this process is condensed into a few seconds of natural language input. By utilizing Visual Paradigm’s professional, AI-powered visual modeling software, teams can transform abstract business requirements into precise, structured diagrams that define how information flows through processes, data stores, and external entities. This transition from a blank canvas to a comprehensive architectural draft represents a significant leap in productivity for software development and business analysis.
In the initial stage of this workflow, the user interacts with a clean, intuitive interface within the Visual Paradigm Desktop application. As seen in the provided visual, a dedicated AI Diagram Generation window appears, allowing the user to specify the diagram type and the desired level of detail. The user simply provides a natural language description, such as a request to visualize the data movement within an online shopping system. This easy-to-use AI diagram maker interprets the text, identifying the core components of the system without the need for the user to manually drag and drop individual symbols or define complex relationships from scratch.
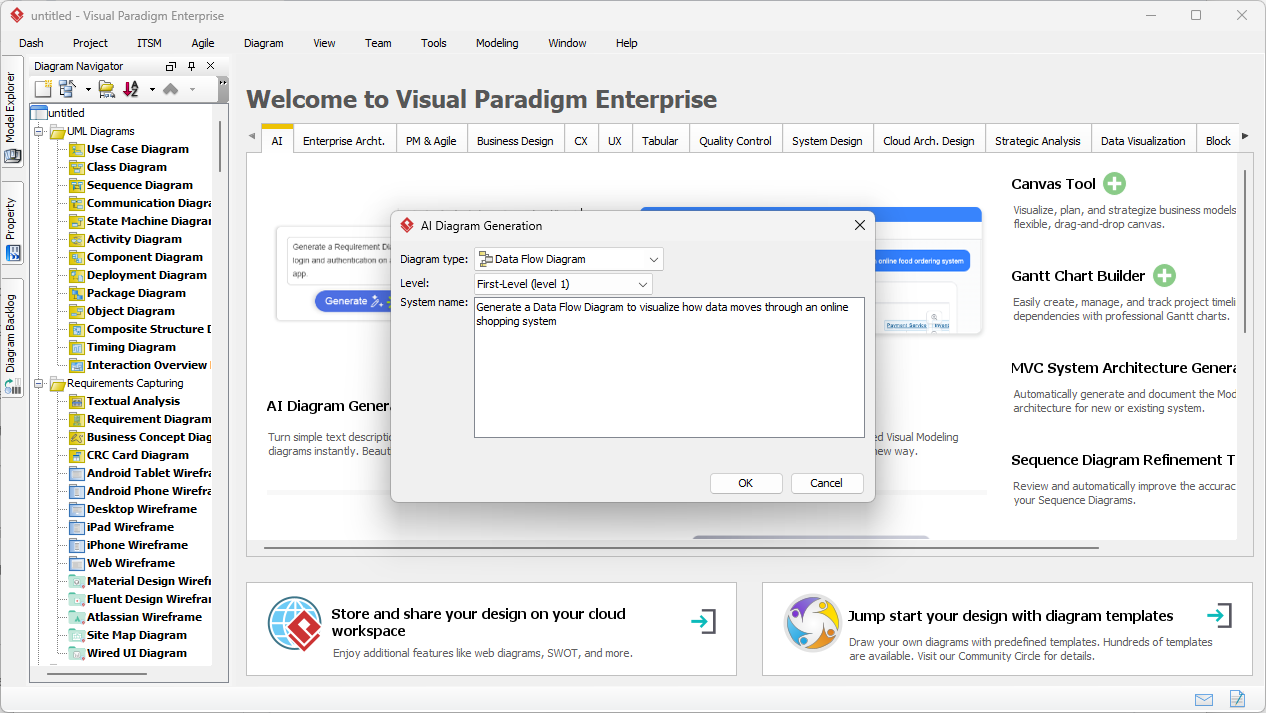
The AI Data Flow Diagram Generator is built upon a robust ecosystem that supports over 40 different editable diagram types, ranging from UML to enterprise architecture. When the user enters a prompt, the underlying AI engine analyzes the functional requirements to distinguish between external entities like customers, internal processes like order validation, and data repositories like inventory databases. This intelligent inference ensures that the resulting model is not just a collection of shapes, but a logically sound representation of the system’s data lifecycle. By selecting a specific level, such as a Level-1 DFD, the user can control the granularity of the visualization to suit the needs of different stakeholders.
Strategic Benefits of AI-Driven Data Modeling
Integrating an AI-powered DFD tool into the standard system analysis and design life cycle offers several objective advantages. For many professionals, the most difficult part of modeling is overcoming the “blank canvas” syndrome, where starting a complex diagram feels overwhelming. The AI serves as a sophisticated assistant that provides an 80% completion rate almost instantly, leaving the remaining 20% for the human expert to refine, detail, and validate. This collaborative approach ensures that the technical accuracy of a professional diagramming app is maintained while leveraging the speed of generative artificial intelligence.
Key Takeaways for System Architects
- Rapid Prototyping: Convert system process descriptions into functional Data Flow Diagrams in seconds rather than hours.
- Notation Flexibility: Supports multiple standards including Gane-Sarson, Yourdon & Coad, and Yourdon DeMarco styles.
- Structural Integrity: Automatically identifies processes, data stores, and external entities from plain English text.
- Editable Outputs: Generated diagrams are fully native to the Visual Paradigm environment, allowing for manual refinement.
- Leveled Decomposition: Effortlessly create Context-level (Level 0) or detailed Level-1 and Level-2 diagrams.
Once the AI Data Flow Diagram Generator processes the input, it produces a clear, logically organized diagram. In the example of an online shopping system, the AI generates a Level-1 DFD that highlights key interactions. The resulting diagram displays processes such as “Process Payments” and “Manage Product Catalog,” connected by clearly labeled data flows like “Payment Request” and “Order Details.” External entities like the Customer and Admin are positioned logically to minimize line crossings, ensuring that the final output is presentation-ready and meets industry standards for documentation and clarity.
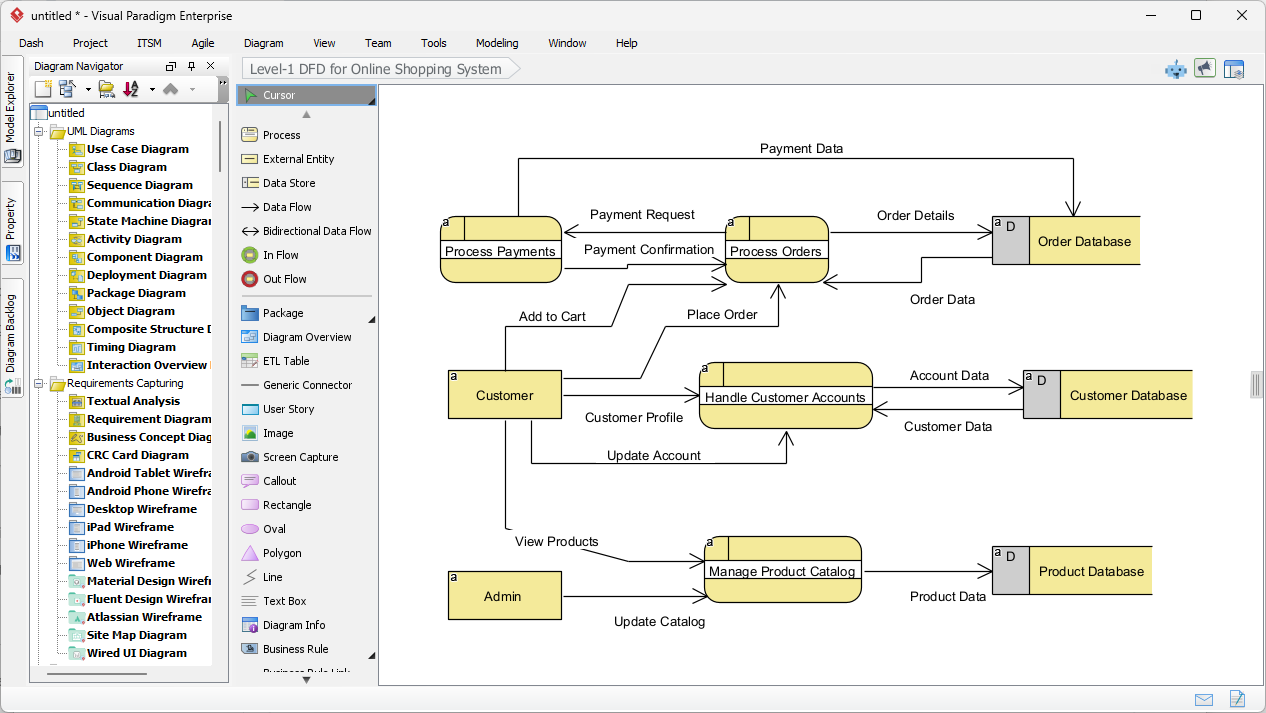
The strength of this automated data flow diagram software lies in its ability to handle complex data relationships with precision. As depicted in the generated model, the AI correctly identifies that “Order Details” should flow from the “Process Orders” process into the “Order Database” data store. It also distinguishes between administrative tasks, such as updating the catalog, and customer-centric tasks like placing an order. This level of semantic understanding allows the AI Data Flow Diagram Generator to create models that are immediately useful for developers who need to understand the backend data requirements and for business analysts who need to verify functional specifications.
Enhancing the Modeling Lifecycle with Professional Tools
Beyond the initial generation, Visual Paradigm offers a comprehensive suite of tools to further the modeling process. Because the output is a native diagram, users can leverage the desktop edition’s advanced features, such as code engineering, database generation, and team collaboration. For instance, a process identified by the AI can be decomposed further into subprocesses, or linked to specific user stories and requirement diagrams. This seamless integration ensures that the AI Data Flow Diagram Generator is not an isolated utility, but a foundational component of a holistic enterprise architecture strategy.
Furthermore, the best AI visual modeling software must provide flexibility in visual representation. Different organizations or academic institutions may prefer specific notations. Visual Paradigm addresses this by allowing users to choose between standard DFD styles, Gane-Sarson, or Yourdon notations. The AI adapts the symbols—using circles or rounded rectangles for processes and parallel lines or open rectangles for data stores—based on the user’s preference while maintaining the underlying logic of the data movement. This capability ensures that the generated documentation always aligns with project-specific standards.
Common Workflows for Data Flow Analysis
The application of an easy-to-use DFD tool extends across various project phases. In the requirement gathering phase, analysts can use the AI to quickly visualize a client’s verbal description of a business process, allowing for immediate feedback and correction. During the system design phase, developers can use the generated DFDs to map out API endpoints and database interactions. Even for quality assurance, these diagrams serve as a source of truth to verify that all data inputs have corresponding outputs and that no information is “lost” within the system architecture.
To maximize the effectiveness of the AI Data Flow Diagram Generator, users should focus on providing detailed, action-oriented descriptions. Specifying the origin of data, the transformations it undergoes, and where it is eventually stored allows the AI to produce more nuanced models. For example, describing how an “Inventory Check” occurs between an “Order Validation” process and an “Inventory Store” provides the AI with the necessary context to draw specific, unidirectional data flows that accurately represent the system’s internal logic.
Conclusion: The Future of System Documentation
The evolution of AI-powered visual modeling has transformed diagramming from a manual chore into a strategic asset. By utilizing the AI Data Flow Diagram Generator within Visual Paradigm, professionals can ensure their system architectures are documented with speed, accuracy, and standardized precision. Whether you are modeling a simple retail process or a complex multi-tier enterprise system, the ability to generate a robust foundation from text allows your team to focus on innovation rather than administrative overhead. The clarity provided by these automated visuals facilitates better communication between stakeholders and technical teams, ultimately leading to more successful project outcomes.
Are you ready to accelerate your system analysis and design process? Experience the efficiency of the best AI visual modeling software today. You can start by downloading the application and exploring the powerful capabilities of the AI Data Flow Diagram Generator to bring your system descriptions to life.
Try Visual Paradigm Today: Download Visual Paradigm Desktop and start generating professional diagrams with the power of AI.
Related Links
The integration of artificial intelligence into Data Flow Diagram (DFD) creation allows teams to automate the visualization of complex information systems directly from natural language descriptions,. These resources highlight how AI-powered chatbots and generators reduce modeling time while maintaining accuracy in representing data movement, system processes, and external entities,. By utilizing these automated modeling tools and comprehensive tutorials, developers and business analysts can ensure that their information flows are accurately documented and easily communicated,.
- Visual Paradigm’s AI Diagram Generator Expands Instant Creation of DFDs: Visual Paradigm’s AI diagram generator has been expanded to support the instant creation of Data Flow Diagrams (DFD) alongside other critical technical diagrams.
- New Diagram Types Added to AI Diagram Generator: DFD & ERD: A recent product update has officially added Data Flow Diagrams as a supported type for automated AI diagram generation.
- Mastering AI-Driven Systems Engineering: Case Study on DFD Creation: This case study explores how an AI-powered chatbot can significantly improve efficiency during the system modeling and data flow diagram development phases.
- Unlock the Power of Data Flow Diagrams (DFD) with Visual Paradigm: Utilizing Visual Paradigm’s comprehensive ecosystem allows teams to leverage advanced DFD modeling and collaborative design features.
- Step-by-Step Guide to Creating Data Flow Diagrams with Visual Paradigm: This technical tutorial provides users with structured instructions to build professional data flow diagrams using the modeling software platform.
- Demystifying Information Flow with DFDs: A Comprehensive Guide: This guide clarifies the role of information flow by explaining how DFDs model data movement across various organizational and system components.
- How to Create Data Flow Diagram (DFD)? – Visual Paradigm Tutorial: This beginner-friendly tutorial offers an overview of how to visually depict data movement through system processes to assist in software design.
- Interactive Data Flow Diagram Maker Tool – Features Overview: This specialized interactive tool provides a streamlined interface designed for creating professional and clear data flow diagrams online.
- What is Data Flow Diagram? – Comprehensive Guide: This comprehensive guide details how DFDs graphically represent processing and data transfers within a business information system.
- AI Chatbot for Diagram and Model Generation: This AI-powered chatbot interface empowers users to generate a variety of diagrams and models using natural language input.