Introduction
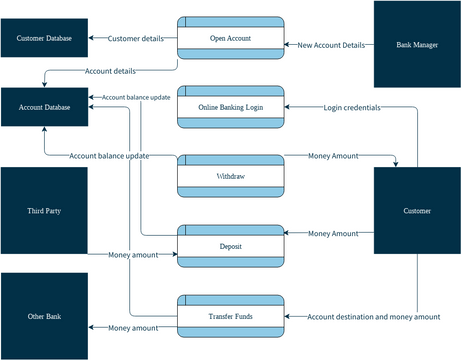
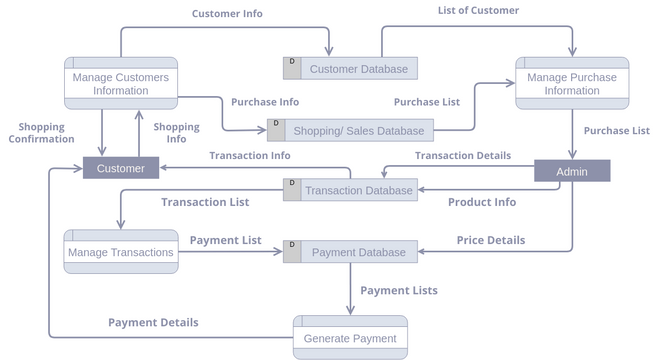
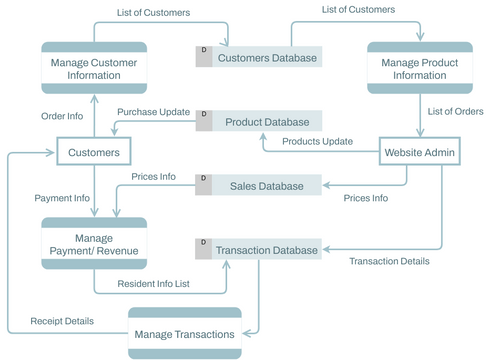
Data Flow Diagrams (DFDs) serve as a time-tested and traditional visual representation, offering a comprehensive insight into the intricate web of information flows within a system. This graphical tool is instrumental in illustrating how data navigates through the various facets of an information system, encompassing processes, data storage, and the generation of reports.
Hierarchy and Decomposition
One of the key strengths of DFDs lies in their ability to decompose a system into manageable subsystems. These subsystems can then be further broken down into lower-level components, creating a hierarchical structure. This hierarchical approach enables a systematic exploration of the system, with each layer dedicated to a specific process or data function. The foundational level, known as Level 0 or the context level, provides an overarching view of the entire system, while subsequent levels, such as Level 1 diagrams, delve into the specifics of individual processes.
Visualization and Documentation
Utilizing data flow diagrams facilitates a visual understanding of how data moves between different processes within a system. Information technology professionals and systems analysts leverage DFDs as a documentation tool to elucidate the intricacies of data flow to end-users. The process often begins with an overarching view, allowing analysts to gradually zoom into the finer details of each process.
Systematic Exploration
DFDs offer a systematic approach to exploring and understanding complex systems. Analysts can initiate the exploration at a higher level, capturing the essence of the entire system, before progressively zooming into the nuances of individual processes. This methodical progression ensures that the system is comprehensively documented while allowing for detailed elaboration where necessary.
Flexibility in Representation
Whether the system is manual, automated, or a combination of both, a well-constructed DFD can adapt to various scenarios. This flexibility makes DFDs a versatile tool suitable for a wide range of systems, accommodating different levels of complexity.
Preliminary Overview
DFDs are often employed as a preliminary step in system analysis. By providing an initial overview of the system without delving into excessive detail, DFDs lay the groundwork for subsequent elaboration. This strategic approach ensures that the essential components and interactions are captured efficiently before diving into the granular aspects of system requirements.
Conclusion
Data Flow Diagrams stand as an invaluable asset in the arsenal of information technology professionals and systems analysts. Their ability to visually represent complex data flows, facilitate systematic exploration, and adapt to various system architectures makes them a cornerstone in the process of understanding and documenting information systems. Whether used as a preliminary step or a detailed exploration tool, DFDs play a crucial role in unraveling the intricacies of modern-day systems.


