Home » Archives for March 2023 » Page 4
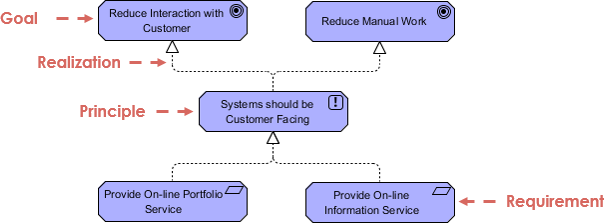
TOGAF ADM Techniques - Architecture Principles The Open Group Architecture Framework (TOGAF) is a widely adopted framework for enterprise architecture (EA) that provides a common language, methodology, and tools for designing, planning, and implementing an organization's IT infrastructure. One of the key components of TOGAF is the Architecture Development Method (ADM), which provides a step-by-step process for creating and managing an enterprise architecture. Within the ADM, there are various techniques that can be used to support the development of an organization's architecture. In this article, we will focus on one of these techniques:…
continue reading →
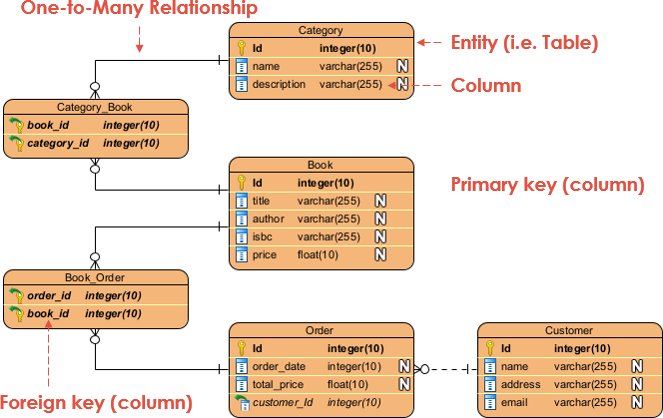
Data modeling is the process of creating a visual representation of the data and its relationships in a database. One of the most commonly used tools for data modeling is the Entity Relationship Diagram (ERD), which uses graphical symbols to represent entities, attributes, and relationships. In this article, we will explore the process of data modeling using an ERD and provide examples of how it can be used in real-world scenarios. What is an Entity Relationship Diagram (ERD)? An ERD is a graphical representation of entities, their attributes, and the relationships between them.…
continue reading →
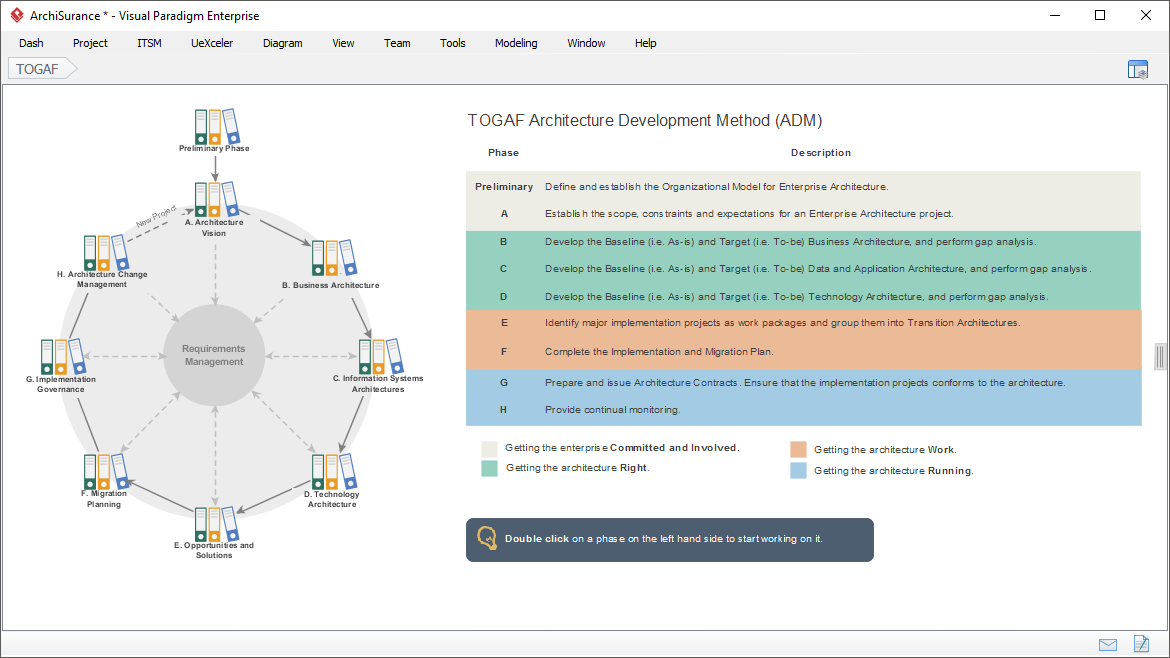
The Architecture Development Method (ADM) is a key component of the TOGAF framework, which provides a comprehensive approach to enterprise architecture development. The ADM provides a structured approach for developing and managing enterprise architectures that align with business objectives and meet stakeholder needs. To maximize the benefits of the ADM process, it is important to understand how it can be adapted to meet the specific needs of an organization. The TOGAF ADM Guidelines provide practical guidance for adapting the ADM process to deal with a range of different usage scenarios, such as incorporating…
continue reading →
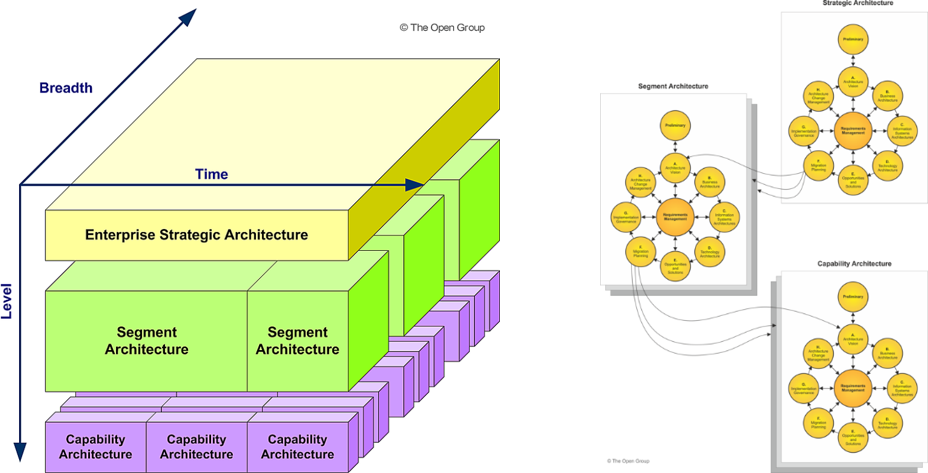
In the world of enterprise architecture, TOGAF® is a well-known and widely used framework that provides a comprehensive approach to designing, planning and implementing enterprise information technology architecture. Developed in 1995 by The Open Group, TOGAF® has become a globally recognized standard for enterprise architecture and is used by organizations of all sizes and types, including government agencies, financial institutions, and multinational corporations. This article will provide an overview of the TOGAF® framework, its benefits, and how it can be used in practice. Introduction to Enterprise Architecture Enterprise architecture is the process of aligning an…
continue reading →
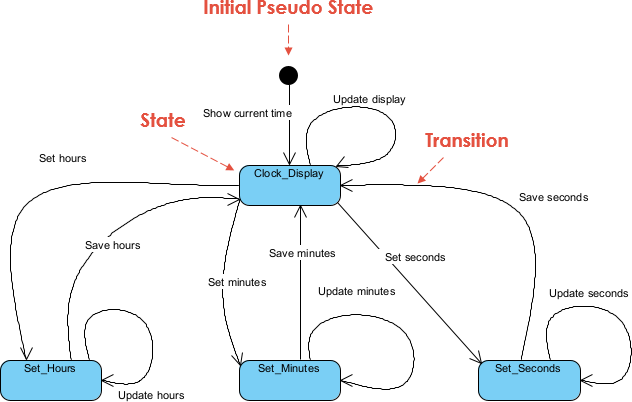
What is a State Diagram State chart diagrams, also known as state machine diagrams, are a popular visual modeling tool used in software engineering to represent the behavior of complex systems. A state chart diagram describes the various states that a system can be in and the events or conditions that cause transitions between states. It is a powerful modeling tool that can be used in a variety of applications, including software development, control engineering, and business process modeling. In this comprehensive guide, we will explore the key concepts and elements of state…
continue reading →
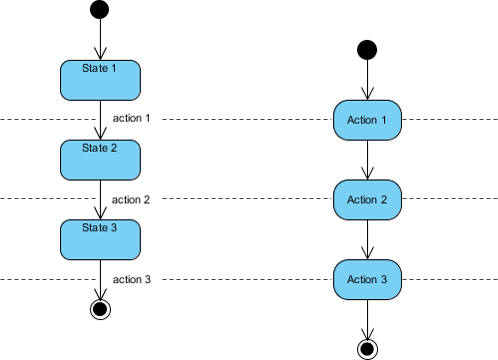
State Chart vs Activity Diagram State chart and activity diagram are two popular tools used in software development to model complex systems. Although both of these diagrams are used for similar purposes, there are significant differences between them. In this article, we will compare state chart and activity diagram and explain their similarities and differences. State chart Diagrams A state chart diagram is a type of diagram used to describe the behavior of a system in response to internal or external events. It shows the different states of an object and the transitions…
continue reading →
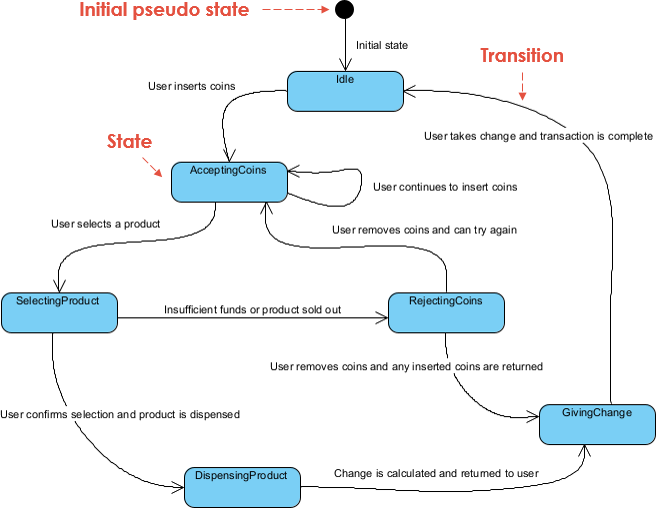
State diagrams, also known as state machines or finite state machines, are a visual representation of how a system or process behaves over time. They consist of a set of states, transitions between states, and events that trigger those transitions. By breaking down a system's behavior into discrete states and transitions, a state diagram can help designers and developers better understand how the system works and identify potential issues or areas for improvement. State diagrams can be used to model a wide variety of systems, from simple machines like vending machines to complex…
continue reading →
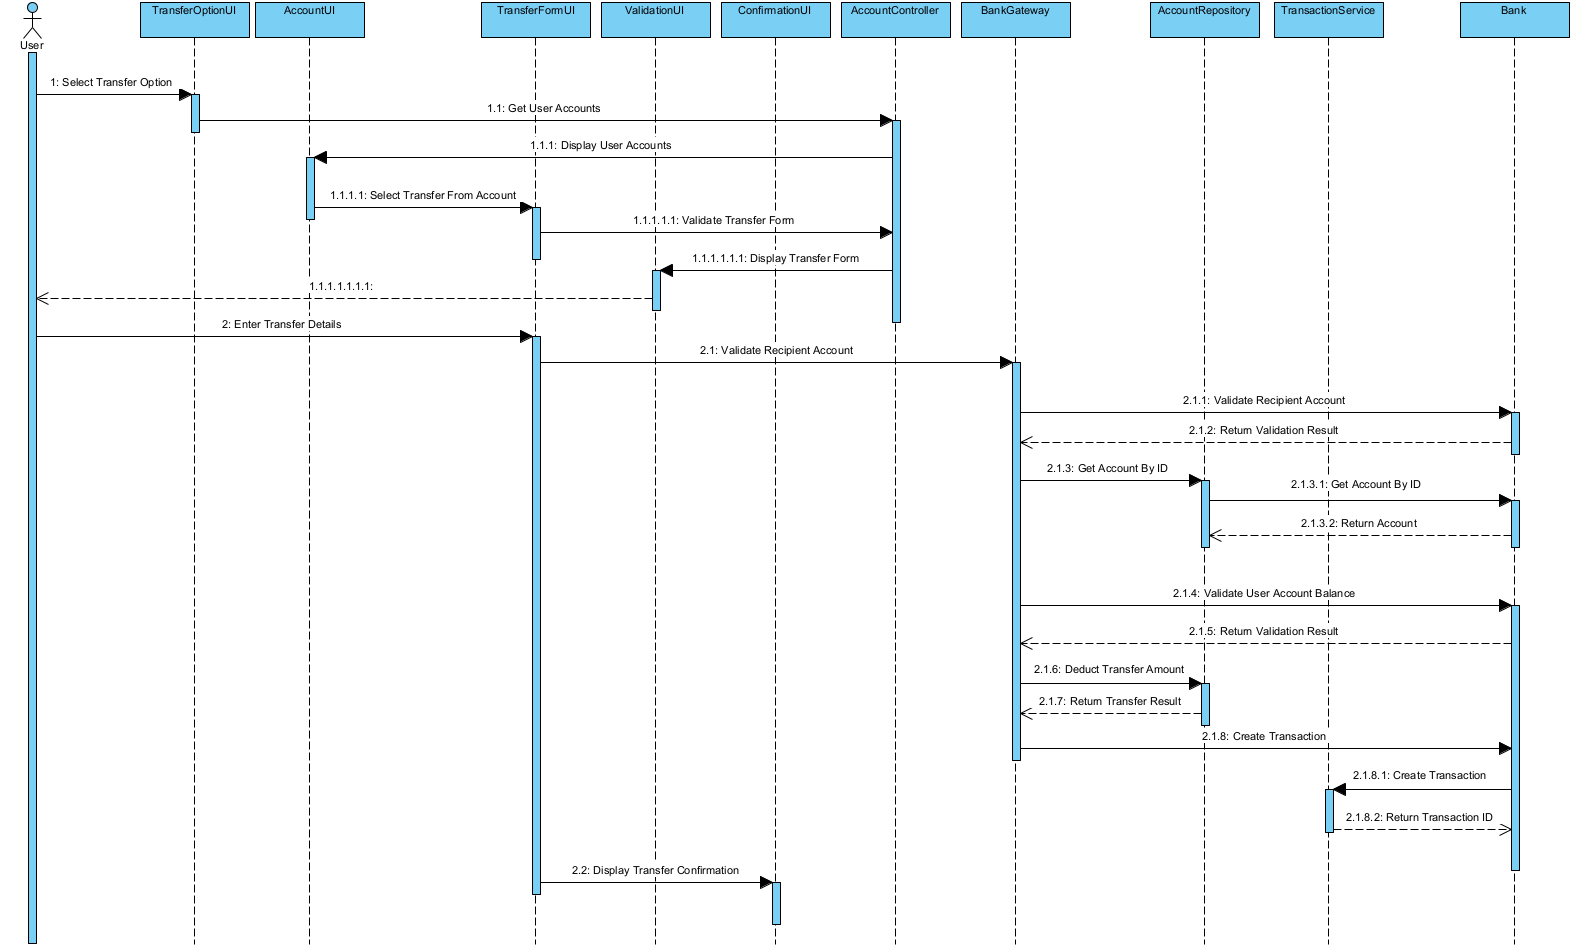
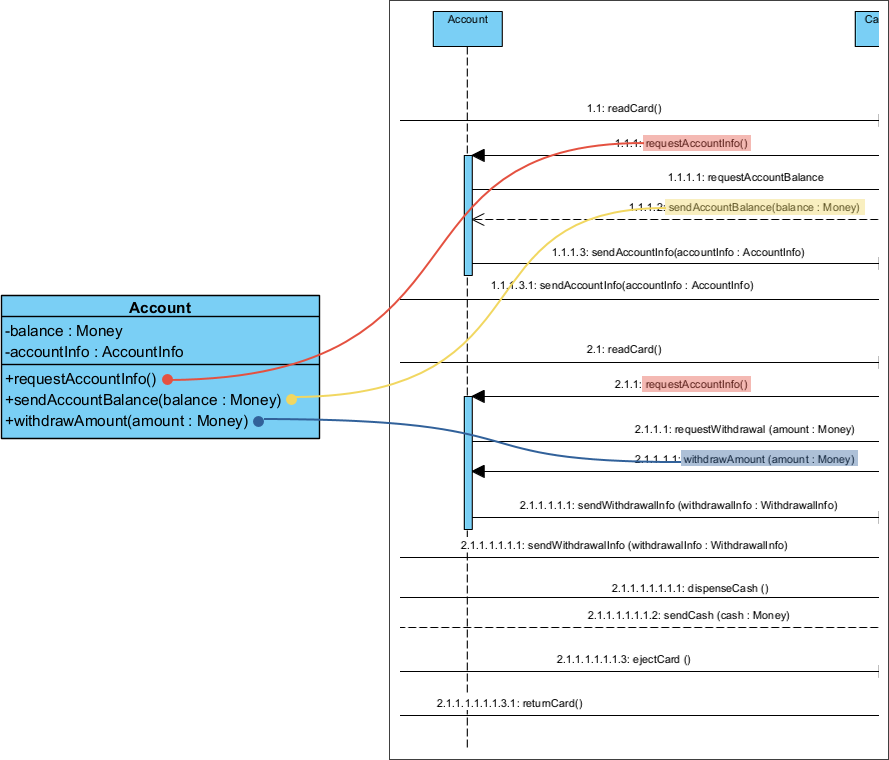
What is a Sequence Diagram Software development requires an efficient communication and understanding between all stakeholders involved in the project. One of the essential tools for effective communication and understanding is the sequence diagram. A sequence diagram is a graphical representation of the interactions between different components of a system over time. To create a sequence diagram that accurately depicts the interactions within a system, it is crucial to follow a well-defined process. They are commonly used in software development to depict the flow of messages between objects and the order in which…
continue reading →
Benefits of Iterative and Incremental Development in OOAD Iterative and incremental are two concepts that are widely used in Object-Oriented Analysis and Design (OOAD). These concepts are used to describe the development process of a software system. Iterative development is a process in which the software is developed in small increments. Each increment adds some functionality to the software, and the software is tested after each increment. The feedback from the testing is used to refine the requirements and design of the system. The process is repeated until the software meets the desired…
continue reading →
How to Maintain Consistent Use Scenario and Model Development The process of creating a use case description with associated sequence and activity diagrams is an essential step in software development. A use case is a description of how a system interacts with its environment to achieve a particular goal. Use cases are used to identify the requirements of a system and ensure that it meets the needs of its users. Sequence diagrams are used to model the interactions between different objects or components of the system over time, while activity diagrams show the…
continue reading →

