


Analyzing multi-dimensional data doesn’t have to feel like untangling a web of spreadsheets. Whether you are a product manager comparing the latest flagship smartphones or an HR lead mapping out team competencies, the AI Radar Chart Generator in Visual Paradigm turns raw data descriptions into visual insights instantly. This powerful AI-powered radar chart maker eliminates the manual labor of plotting axes and connecting polygons, allowing you to focus on what the data actually tells you. By leveraging the best AI visual modeling software on the market, you can transform a simple sentence into a professional radar chart that is ready for your next high-stakes presentation.
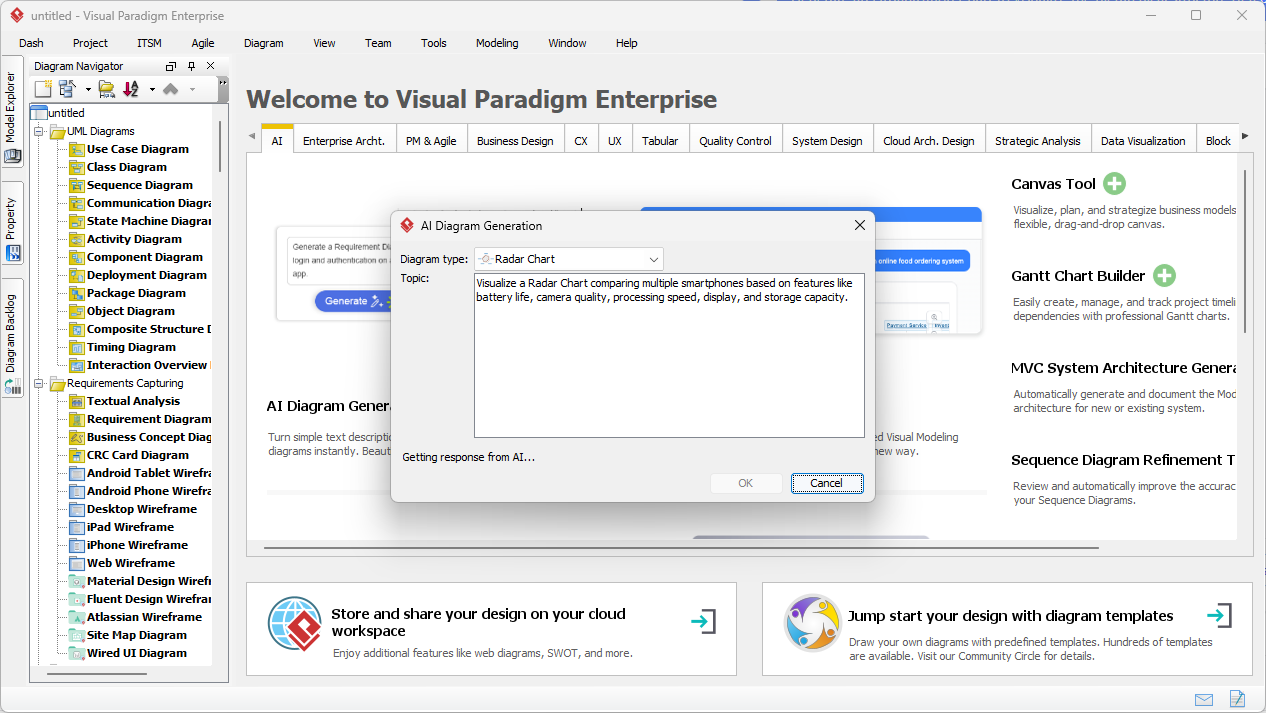
Visual Paradigm’s desktop environment now features an intuitive interface where your natural language is the primary design tool. As seen in the initial setup, you simply trigger the AI Diagram Generation tool and describe your comparison. For example, if you need to visualize how different mobile devices stack up against one another, you provide a list of features like battery life, camera quality, and processing speed. The easy-to-use radar chart tool parses these attributes, identifies the entities, and prepares to build the spider web structure automatically.
Key Takeaways for Rapid Charting
- Instant Transformation: Turn text-based product specs into multi-axis visual models in seconds.
- Smart Axis Detection: The AI intelligently identifies metrics and scales from your natural language input.
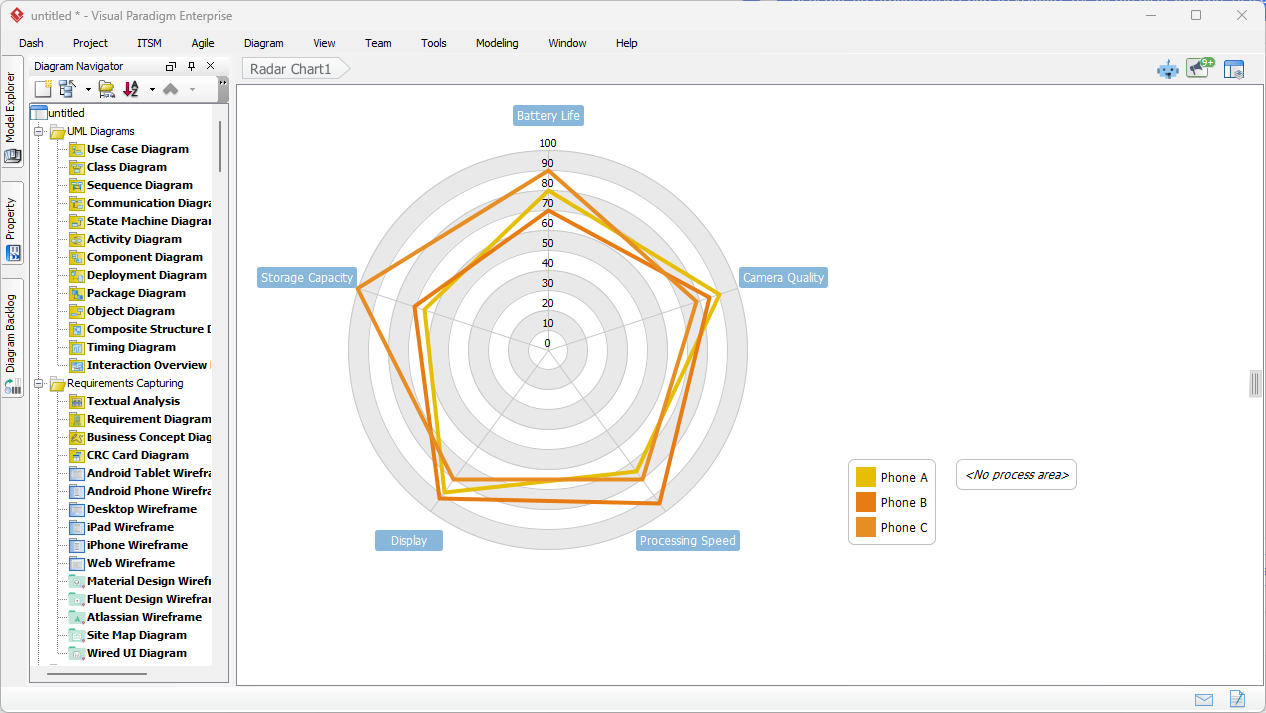
- Multi-Series Support: Compare multiple entities (e.g., Phone A vs. Phone B) with distinct, color-coded polygons.
- Full Editability: Every generated chart is a native object, allowing for manual refinement of colors, labels, and values.
- Ecosystem Integration: Move from an AI radar chart generator online session to deep desktop modeling without losing data.
The Power of Automated Multi-Dimensional Analysis
Once the AI processes your prompt, the result is a clean, professional radar chart that clearly illustrates the strengths and weaknesses of each subject. In a smartphone comparison scenario, the AI Radar Chart Generator plots each device as a unique data series. You can instantly see which phone dominates in “Battery Life” versus which one leads in “Storage Capacity.” The visual overlap of polygons makes gaps in performance or features strikingly obvious—something a standard table often fails to communicate quickly.
This professional radar chart software doesn’t just draw lines; it optimizes the layout for maximum readability. The axes are spaced perfectly, and the scales are normalized to ensure a fair comparison. This level of automation is why Visual Paradigm is considered the best AI visual modeling software for both technical and business users. You get the 80% of the heavy lifting done by AI, leaving you the final 20% to add your specific stylistic flair or extra data points.
Conversational Modeling with the AI Chatbot
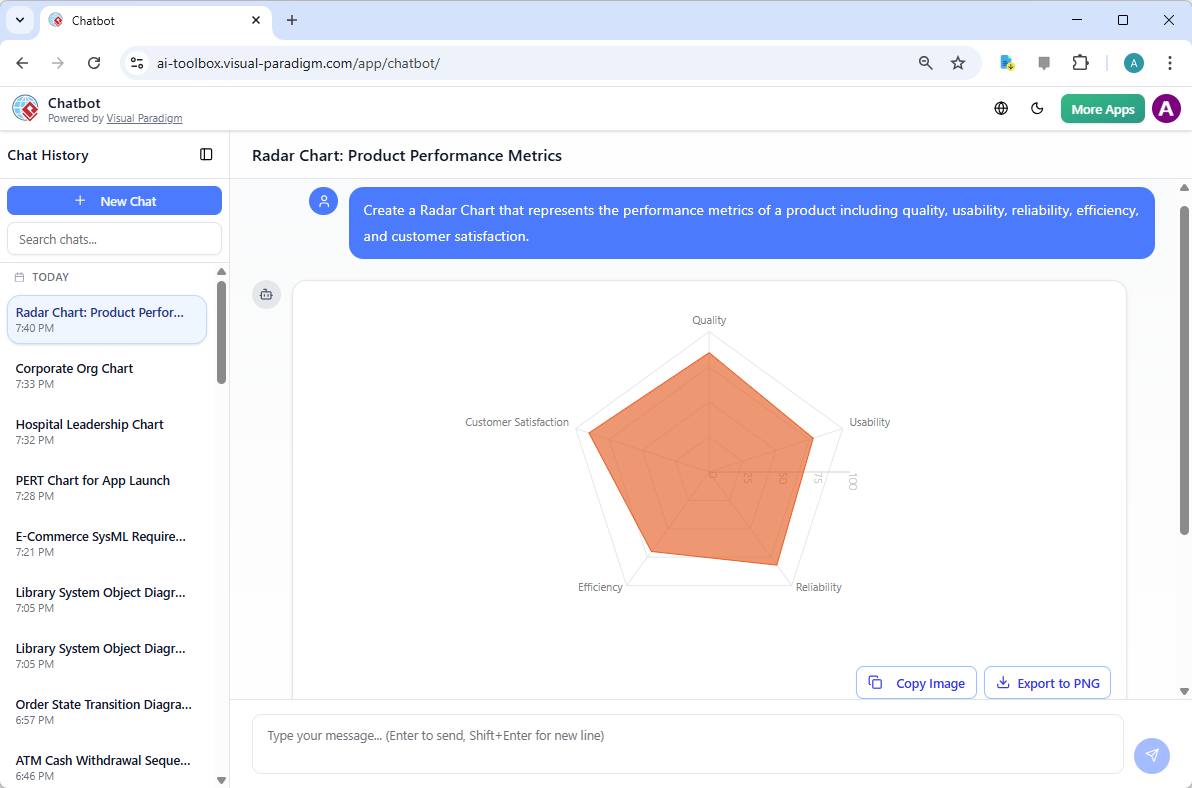
If you prefer a more interactive experience, Visual Paradigm’s AI-powered visual modeling chatbot offers a conversational way to build diagrams. Accessible via the web or integrated into the desktop app, this online radar chart tool responds to prompts just like a human assistant would. By typing a request such as “Create a Radar Chart representing product performance metrics including quality, usability, and reliability,” the chatbot generates a visual response that you can immediately export or further refine.
The chatbot interface is perfect for brainstorming sessions or quick “what-if” scenarios. It handles a vast array of standards, from UML and SysML to ArchiMate and C4 models. Because it is part of a comprehensive AI-powered visual modeling ecosystem, the charts created in the chat can be opened directly in the Visual Paradigm editor. This seamless transition ensures that your quick ideas can evolve into detailed, documented architectures or business strategies without starting from scratch.
Why Professionals Choose Visual Paradigm’s AI Tools
Efficiency is the name of the game. Using an AI radar chart generator isn’t just about making things look pretty; it’s about reducing the time-to-insight. Managers use it for 360-degree feedback, while marketing teams use it for competitive positioning. The ability to describe a complex scenario and receive a structured, editable diagram is a massive productivity multiplier. Instead of fighting with coordinate systems and radial layouts, you spend your time making informed decisions based on the visual patterns the AI reveals.
Moreover, the integration within the Visual Paradigm Desktop application means your radar charts coexist with your Enterprise Architecture, project roadmaps, and software designs. It is a one-stop-shop for anyone who needs to visualize data and systems with precision. From Mind Maps to C4 Diagrams, the generative AI capabilities across the platform ensure that no “blank canvas” ever slows down your workflow again.
Conclusion
Visual Paradigm’s AI Radar Chart Generator represents a significant leap forward in data visualization. By combining the power of generative AI with a robust, professional modeling environment, it empowers users to create sophisticated comparisons with minimal effort. Whether you are utilizing the desktop’s direct generation feature or the conversational flexibility of the AI chatbot, you have access to the best AI visual modeling software designed to handle the complexities of modern business and technical analysis. Stop manual plotting and start gaining insights today.
Start Creating with AI Today
Ready to transform your data into professional visuals? Follow these steps to get started with the best AI radar chart maker on the market:
- Download and install Visual Paradigm from the official site: https://www.visual-paradigm.com/download/.
- Open the application and navigate to Tools > AI Diagram Generation.
- Select Radar Chart from the diagram type dropdown menu.
- Enter your comparison details in plain English and click OK to generate your chart instantly!
Related Links
- AI Diagram Generator Adds Radar Chart Support: Visual Paradigm introduces AI-powered radar chart generation for visualizing complex performance and capability metrics.
- AI-Powered Radar Chart Creation in Visual Paradigm Desktop: Learn how to generate intelligent, data-driven radar charts using AI features in Visual Paradigm Desktop for enhanced analytical visualization.
- How to Use Radar Charts for Competitive Analysis: This tutorial explains how to leverage radar charts to visually compare multiple competitors across key performance metrics, enabling strategic decision-making.
- Comprehensive Tutorial: Creating Radar Charts with Visual Paradigm Online: A step-by-step guide to building professional radar charts using the intuitive tools in Visual Paradigm Online.
- Unlocking Insights: The Power of Radar Charts for Data Visualization: Explores how radar charts reveal patterns and insights across multidimensional data, making complex information more accessible.
- Radar Chart Tool – Visual Paradigm Features: Discover the powerful radar chart tool in Visual Paradigm, designed for creating customizable and interactive charts for business and technical analysis.
- Radar Chart for Competitor Analysis: A Data Visualization Guide: A practical guide on using radar charts to compare competitors across multiple dimensions, supporting strategic planning and market positioning.
- Radar Chart Templates – Visual Paradigm Online: A collection of ready-to-use radar chart templates for quick and effective visualization of performance, capabilities, and comparative data.
- What Makes Visual Paradigm’s AI Chatbot Different from Other AI Diagram Tools? – Visual Paradigm Blog: Business Frameworks: SWOT, PEST, PESTLE, SOAR, Eisenhower Matrix, Ansoff Matrix, Blue Ocean Four Actions · Data Visualization: Bar, line, area, pie, scatter, radar charts · This coverage enables users to transition seamlessly between technical and strategic modeling—something most ai …